If you would like to read the other parts in this article series please go to:
Introduction
One of the most popular requests from all the Messaging Administrators around the World is the ability to generate comprehensive reports for the environment they manage. If a picture is worth a thousand words, one can easily understand the need to transform the thousands of log files one Exchange server can generate into something more human-friendly.
Since Exchange Server 2007 (and all previous versions) does not include “out-of-the-box” capability to generate rich graphical reporting, there are few companies that successfully filled the gap by building reporting software for Microsoft Exchange (if you are willing to pay for it).
As for Microsoft, the software giant release in 2005 the SQL Server 2000 Report Pack for Microsoft Exchange, which was a stripped down version of Exchange Reporter, a commercial software developed by a company called SSW. I must confess that I never used the SQL Server 2000 Report Pack for Microsoft Exchange because, let’s face it, the requirement of SQL Server and SQL Server Reporting Services is a little bit overkill, to say the least.
But Microsoft did a very nice job with a different approach. Microsoft Operations Manager (MOM) 2005 with the Exchange Server Management Pack had some very strong reporting capabilities. Unfortunately, the Exchange Server Management Pack for the next version of Microsoft’s management software, System Center Operations Manager (SCOM) 2007 lost some of the reports previously included. The good news is that the latest Microsoft Exchange Server 2007 Management Pack for System Center Operations Manager 2007 R2 provides (again) more than 30 reports specific to Exchange Server 2007 that track availability and performance.
But when I decided to write this article, it was never my idea to use commercial (paid) software, nor to use the reporting capabilities of systems management software. Instead I wanted to provide rich graphical reporting capabilities for Exchange Server, using only simple and free tools, some from Microsoft, others developed by Microsoft MVPs and general passionate people around the World.
It is all about the logs!
OK, I said Exchange Server does not include native graphic reporting capabilities, but this does not mean it does not generate all the information you will ever need (and maybe more). It is all about the logs!
Do you know what kind of informational logs are available on a regular Exchange Server organization? Table 1 lists the most common ones. Note that these logs can be spread across different Exchange servers, since all the Exchange roles would not probably be collocated on the same machine.
|
Log |
Default Path |
|
Protocol Logs (SMTP Send) |
\Exchange Server\TransportRoles\Logs\ProtocolLog\SmtpSend |
|
Protocol Logs (SMTP Receive) |
\Exchange Server\TransportRoles\Logs\ProtocolLog\SmtpReceive |
|
Agent Logs |
\Exchange Server\TransportRoles\Logs\AgentLog |
|
IIS Logs |
[Windows 2003] \Windows\System32\LogFiles\W3SVC1
[Windows 2008] \Inetpub\Logs\LogFiles\W3SVC1 |
|
Message Tracking Logs |
\Exchange Server\TransportRoles\Logs\MessageTracking |
|
POP3/IMAP Logs |
\Exchange Server\ClientAccess\PopImap |
|
Connectivity Logs |
\Exchange Server\TransportRoles\Logs\Connectivity |
|
Pipeline Tracing Logs |
\Exchange Server\Transport Roles\Logs\PipelineTracing |
|
Routing Table Logs |
\Exchange Server\TransportRoles\Logs\Routing |
|
MRM Logs |
\Exchange Server\Logging\Managed Folder Assistant |
Table 1: Common Exchange logs
The next step is to correctly configure logging level, since not all the logs are enabled by default, and for some of them there are a few adjustments that need to be made regarding the desired historical data we want to keep.
In this article we will use only the first five logs from the table above. From this five, the only two that are not enabled by default are both protocol logs: SMTP Send and SMTP Receive. The SMTP transport logging level is controlled at the Exchange connector level.
In order to create useful Exchange graphical reports, I would say that the protocol logs from the servers on the border of your network are particularly important, since they register the SMTP transactions from mail that enters or leaves your organization. In case you have an Edge transport server deployed, and an Edge synchronization in place, these logs can be configured from the internal Hub Transport server (if you try to edit the properties of the connector from the Edge server, you will get the error depicted in Figure 1).

Figure 1: Error changing log level on an Edge server
To enable SMTP Protocol Logs of the EdgeSync Send Connectors, open the Exchange Management Console, expand Organization Configuration, select Hub Transport and then, on the right pane, click the Send Connectors tab. Right click each of the 2 connectors and select Properties (Figure 2).
On the EdgeSync Connector Properties window, change the Protocol logging level to Verbose (Figure 3).

Figure 2: Configuring EdgeSync Send Connector

Figure 3: EdgeSync Send Connector Properties
If you prefer to use PowerShell, run the following cmdlet (for both connectors) to set the logging level to verbose (Figure 4):
Set-SendConnector “EdgeSync – Inbound to Default-First-Site-Name” -ProtocolLoggingLevel Verbose

Figure 4: changing logging level using PowerShell
After enabling the SMTP Transport Logs, we must define the amount of historical data to keep. Exchange Server lets us control the maximum log file size, the maximum directory size and the maximum age of log files, using the Set-TransportServer PowerShell cmdlet.
The SendProtocolLogMaxDirectorySize and ReceiveProtocolLogMaxDirectorySize parameters specify the maximum size of the Send and Receive Connector Protocol Log directories. When the maximum directory size is reached, the server deletes the oldest log files first. The minimum value is 1 MB, the default value is 250 MB.
Since the default 250MB is not enough, let us change the maximum size of the Send Connector directory to 2GB and the Receive connector to 4GB, using Exchange Management Shell:
Set-TransportServer -Identity E2K7EDGE -SendProtocolLogMaxDirectorySize 2048MB -ReceiveProtocolLogMaxDirectorySize 4096MB
Now that we have our logs ready, it is time to start analyzing them.
Please be aware that, depending of the quantity of data you are analyzing, the parsing and processing of the logs can take quite a while!
Log Parser
Log Parser is a powerful tool that provides universal query access to text-based data such as log files, XML files and CSV files, as well as key data sources on the Windows operating system such as the Event Log, the Registry, the file system or even Active Directory. But more than parsing information, the best part of Log Parser is that the results of the queries can be custom-formatted in text based output, such as datagrids, or they can be transformed into nice visual charts.
I do not know about you, but for me it looks like a pretty good candidate to start graphing those juicy Exchange logs. And Log Parser does not need to be installed on the Exchange Server, all you need to do is to guarantee the access to the Exchange logs directories.
Follow these instructions to install Microsoft Log Parser:
-
Download and install Microsoft Logparser 2.2.
-
Download and install Office 2003 Add-in: Office Web Components. This is necessary to provide graphing capabilities to Log Parser.
Log Parser has a comprehensive help file (Figure 5), located by default at C:\Program Files (x86)\Log Parser 2.2, that I strongly advise you to carefully read. There are also a few samples available at C:\Program Files (x86)\Log Parser 2.2\Samples.

Figure 5: Log Parser CHM file
On the next sections I will show you some examples of Log Parser queries that generate the desired visual reports. These queries can be run directly from the command line, or you can create different batch files with each of them (recommended).
Reports using Log Parser with the Agent Logs
If you are using the Exchange Server anti-spam agents, there are a few reports we can get by analyzing the Agent Logs. These logs are located on the Exchange Edge server, if you are using it, or in the Exchange Hub server, in case it has the anti-spam agents enabled and running.
In order to get an idea of the mail that is entering your organization, we can start by organizing the number of messages according to their Spam Confidence Level (SCL) and displaying them in a datagrid.
This is what the command to produce that datagrid (Figure 6) looks like:
|
“C:\Program Files (x86)\Log Parser 2.2\logparser.exe” “SELECT ReasonData, count(*) AS hits FROM C:\Progra~1\Microsoft\Exchan~1\TransportRoles\Logs\AgentLog\AGENT*.log WHERE ReasonData<>NULL GROUP BY ReasonData ORDER BY hits DESC” -i:CSV -nSkipLines:4 -o:DATAGRID -dtlines:800 -rtp:-1 |

Figure 6: Agent reason spread (Datagrid)
If you prefer a pie chart of the previous results, that is pretty easy. By using the –chartType:PieExplode3D parameter in the following command, we get the nice chart depicted in Figure 7.
|
“C:\Program Files (x86)\Log Parser 2.2\logparser.exe” “SELECT CASE TO_INT(ReasonData) WHEN NULL THEN 0 ELSE TO_INT(ReasonData) END AS ReasonData2, count(*) AS hits INTO agentreasonspread.gif from C:\Progra~1\Microsoft\Exchan~1\TransportRoles\Logs\AgentLog\AGENT*.log GROUP BY ReasonData2 ORDER BY hits DESC” -i:CSV -nSkipLines:4 -o:CHART -chartType:PieExploded3D -chartTitle:”Agent Reason Spread” -e 200 -dtlines:600 |

Figure 7: Agent reason spread
Although the SCL varies from 1 to 9, notice there is a slice of the previous pie chart that has the value 0. The value 0 aggregates all the “policy is disabled” and “content filtering was bypassed” (see previous datagrid), meaning it represents mail that entered your organization.
If you prefer a more consolidated view of the previous chart, with only the accepted and rejected mail, the following logparser query does the job. Notice that messages with a SCL rating of 8 or higher are considered rejected, SCL 7 means quarantined, and everything else is classified as accepted.
|
“C:\Program Files (x86)\Log Parser 2.2\logparser.exe” “SELECT CASE TO_INT(ReasonData) WHEN 9 THEN ‘REJECTED’ WHEN 8 THEN ‘REJECTED’ WHEN 7 THEN ‘QUARANTINED’ ELSE ‘ACCEPTED’ END AS ReasonData2, TO_INT(mul(100.0,PropCount(*))) as Percent, count(*) as hits INTO agentAcceptedRejected.gif FROM C:\Progra~1\Microsoft\Exchan~1\TransportRoles\Logs\AgentLog\AGENT*.log GROUP BY ReasonData2 ORDER BY hits DESC” -i:CSV -nSkipLines:4 -o:CHART -chartType:PieExploded3D -chartTitle:”%% Accepted/Rejected mail” -dtlines:600 -categories:OFF -values:ON -view:ON |

Figure 8: % of accepted and rejected mail
Reports using Log Parser with the Protocol Logs
For the next graphs we will use the SMTP Protocol Logs. With these logs we can extract useful information about the volume of SMTP connections and about hosts (but not users).
To have an image of the Total Inbound Simultaneous Connections, we will use the following code:
|
“C:\Program Files (x86)\Log Parser 2.2\logparser.exe” “SELECT QUANTIZE(TO_TIMESTAMP (EXTRACT_PREFIX(TO_STRING(EXTRACT_SUFFIX([#Fields: date-time],0,’T’)),0,’.’), ‘hh:mm:ss’),3600) AS Hour, COUNT(*) AS Hits INTO radar_traffic.gif FROM C:\Progra~1\Microsoft\Exchan~1\TransportRoles\Logs\ProtocolLog\SmtpReceive\RECV*.LOG WHERE event=’+’ GROUP BY Hour ORDER BY Hour ASC” -i:CSV -nSkipLines:4 -o:CHART -charttype:RadarLineFilled -charttitle:” Global total SMTP inbound simultaneous connections per hours” |

Figure 9: Inbound SMTP Connections
If you liked Figure 9 and you would like to see a similar chart for the outbound connections, the output of the following command is the nice radar chart depicted in Figure 10.
|
“C:\Program Files (x86)\Log Parser 2.2\logparser.exe” “SELECT QUANTIZE(TO_TIMESTAMP (EXTRACT_PREFIX(TO_STRING(EXTRACT_SUFFIX([#Fields: date-time],0,’T’)),0,’.’), ‘hh:mm:ss’),3600) AS Hour, COUNT(*) AS Hits INTO radar_traffic_send.gif FROM C:\Progra~1\Microsoft\Exchan~1\TransportRoles\Logs\ProtocolLog\SmtpSend\SEND*.LOG WHERE event=’+’ GROUP BY Hour ORDER BY Hour ASC” -i:CSV -nSkipLines:4 -o:CHART -charttype:RadarLineFilled -charttitle:” Global total SMTP outbound simultaneous connections per hours” |
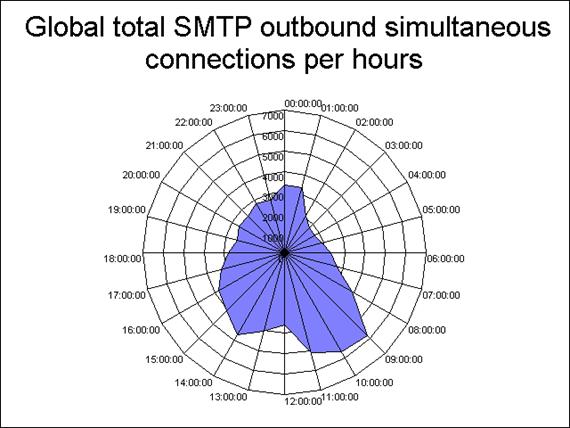
Figure 10: Outbound Simultaneous Connections
The next command analyzes which are the suspicious senders to your organization. In order to achieve that goal, we need to extract from the SMTP Receive Log all the hosts who get status code 500 and above, such as 504, 535, 550 and so on.
This is actually done in 2 steps: the first logparser query extracts the data from the logs, the second command performs a reverse DNS lookup against the first output. The reason this is done in 2 steps is because performing a reverse DNS lookup during data extraction would take too much time.
|
“C:\Program Files (x86)\Log Parser 2.2\logparser.exe” “SELECT EXTRACT_PREFIX(remote-endpoint,0,’:’) AS Remote-host, count (*) AS hits INTO SuspiciousSenders.xml FROM C:\Progra~1\Microsoft\Exchan~1\TransportRoles\Logs\ProtocolLog\SmtpReceive\RECV*.log WHERE TO_INT(SUBSTR(DATA,0,3)) > 500 AND event = ‘>’ GROUP BY Remote-host ORDER BY hits DESC” -i:CSV -nSkipLines:4 -o:XML
“C:\Program Files (x86)\Log Parser 2.2\logparser.exe” “SELECT TOP 10 REVERSEDNS(Remote-host), hits FROM SuspiciousSenders.xml” -i:XML -o:DATAGRID |
Notice there is an internal host on the results depicted in Figure 11. That particular host is probably an internal application server or an authorized internal mail relay.

Figure 11: Suspicious hosts sending mail to your organization
We can also generate a datagrid with the Top Outbound Rejection Errors, by analyzing the SMTP Send Protocol Log. This can be very useful to identify potential outbound errors or to find out if your server is listed on some black list. Here is the command to produce the datagrid from Figure 12:
|
“C:\Program Files (x86)\Log Parser 2.2\logparser.exe” “SELECT CASE TO_INT( SUBSTR(DATA,0,3)) when NULL then 0 else TO_INT( SUBSTR(DATA,0,3)) END AS RemoteHostReturnCode, data, count (*) AS hits FROM C:\Progra~1\Microsoft\Exchan~1\TransportRoles\Logs\ProtocolLog\SmtpSend\SEND*.log WHERE RemoteHostReturnCode > 400 AND context <> ‘Certificate thumbprint’ AND context <> ‘sending message’ GROUP BY RemoteHostReturnCode, data ORDER BY hits DESC” -i:CSV -nSkipLines:4 -o:DATAGRID |

Figure 12: Top outbound rejection errors
One of the most desired reports is the identification of the top sender hosts to our organization. The answer is buried on those SMTP Receive Transport Logs, to uncover it nothing better than a logparser query.
Notice the 2 steps again, the reverse DNS lookup is only made with the output from the first query, in order to optimize the time it takes to finish.
|
“C:\Program Files (x86)\Log Parser 2.2\logparser.exe” “SELECT TOP 10 EXTRACT_PREFIX(remote-endpoint,0,’:’) AS RemoteSendingHost, count(*) AS Hits INTO topsenders.xml FROM C:\Progra~1\Microsoft\Exchan~1\TransportRoles\Logs\ProtocolLog\SmtpReceive\RECV*.LOG WHERE event=’+’ GROUP BY RemoteSendingHost ORDER BY Hits DESC” -i:CSV -nSkipLines:4 -o:XML
“C:\Program Files (x86)\Log Parser 2.2\logparser.exe” “SELECT TOP 10 REVERSEDNS(RemoteSendinghost), Hits INTO topsenders.gif FROM TopSenders.xml” -i:XML -o:CHART -chartType:PieExploded3D -chartTitle:”TOP 10 Senders” -groupSize:1024×768 |

Figure 13: Top sender hosts to your organization
Summary
If you ever wondered why the heck you need so much Exchange logging, or you tend to consider those “undesired” log files as garbage, suddenly they look very useful and are now the key to uncover all kinds of information about your messaging infrastructure. Until the next part of this series, play a little bit with Log Parser and get ready for some heavy querying!
Related Links
- How to Configure Protocol Logging
- Exchange Server 2007: How many logs hath thee?
- Advanced Exchange 2007 Transport Logs Troubleshooting using Log Parser – Part 1
If you would like to read the other parts in this article series please go to: