Log Analytics uses Kusto query language, which is a read-only language to perform queries and retrieve results from the data stored in Log Analytics. At first glance, it is similar to SQL but easier and simpler. A simple example: SELECT * FROM tb_authors in SQL is translated to tb_authors in Kusto language.
Understanding the environment
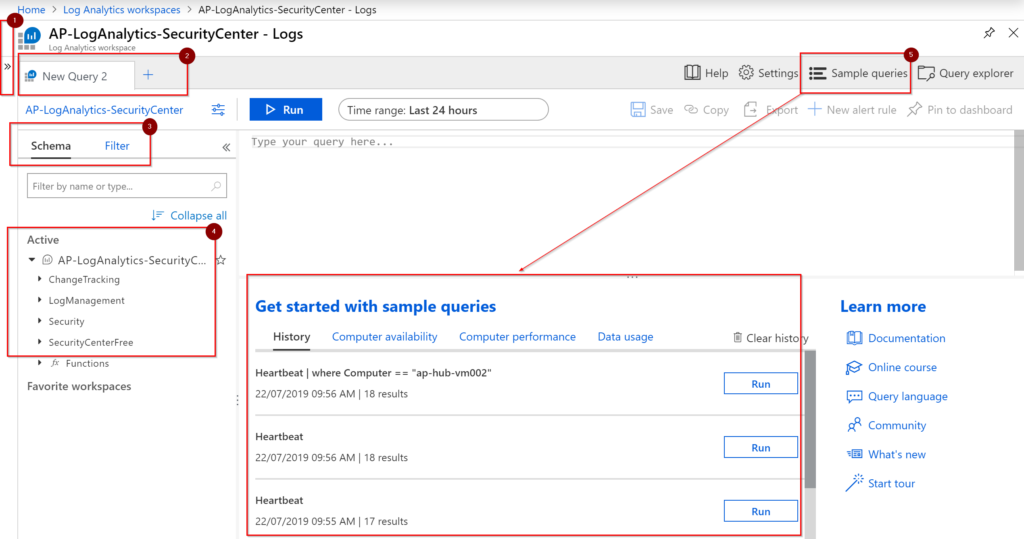
If there is one takeaway from this article, please make sure that you focus on this section. It may look silly at the beginning, but it will save you a lot of time when you start working with queries up and down to retrieve the information that you are looking for. To access the query console, open the Log Analytics Workspace where your resources are reporting to, and then click on Logs. The Logs interface will require a lot of room, so I recommend you tuck away the blade that has all the options to navigate around the Log Analytics workspace (Item 1).
When working with queries, you may need a separate location to test and validate before updating your end-result query, using tabs (Item 2) will save us time and productivity. If you are getting started with this Log Analytics Workspace, the Schema and Filter tabs are going to help you to navigate on those uncharted waters. The Schema tab will show all available solutions, tables, and columns, and the Filter tab will help us to create and narrow down results.
Sometimes, it is easier to see something in action or reuse some queries instead of creating from scratch, and for those cases, we have sample queries (Item 5). To use those built-in queries, click on Run on any of the examples available, and we will have the query being displayed, which we can execute. The real estate is expensive in Logs area, every time that we execute a Run, the sample queries will be replaced by the results. My recommendation is to click on the arrow (Item 1) to get more room for the logs.
Creating your first Log Analytics query (no experience necessary)
If you have no experience with queries, don’t worry, you will be just fine looking around for the information that you want. If you want more advanced stuff, such as charts, columns rename, averages, compares, and use more than one table, some typing will be required. Every single solution will create its own area in the Schema. After connecting the first VMs into Log Analytics, one of the first tables that will be populated with information will be the Heartbeat table, which is located under LogManagement.
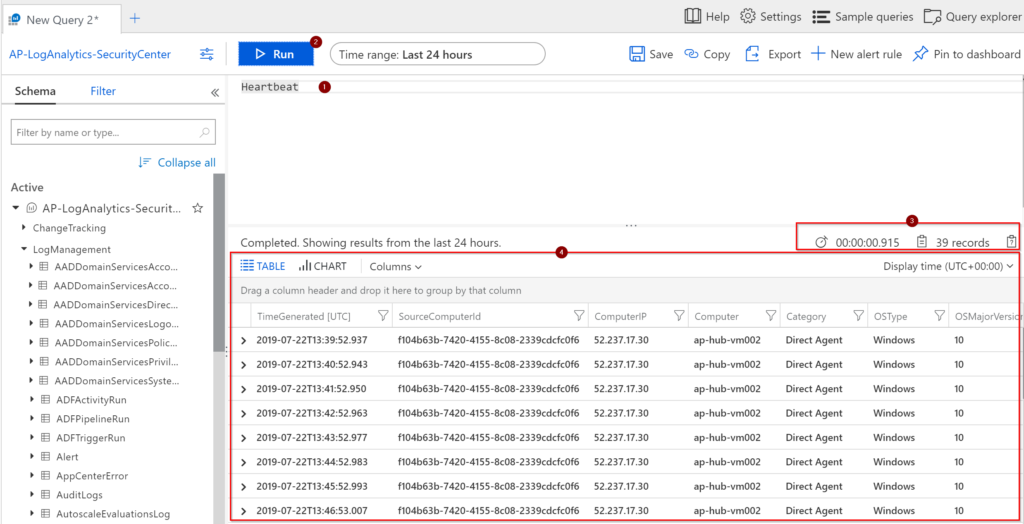
Start by clicking on Schema, expand LogManagement, and double click on Heartbeat. This action places the Heartbeat (Item 1) automatically in the query editor. Click on Run (Item 2) to see all the results that we have in that table. The results can be seen in Item 4, where information about that table will be displayed. Before going to the next step, check Item 3. We will have the time that was required to execute the query and how many records it was retrieved.
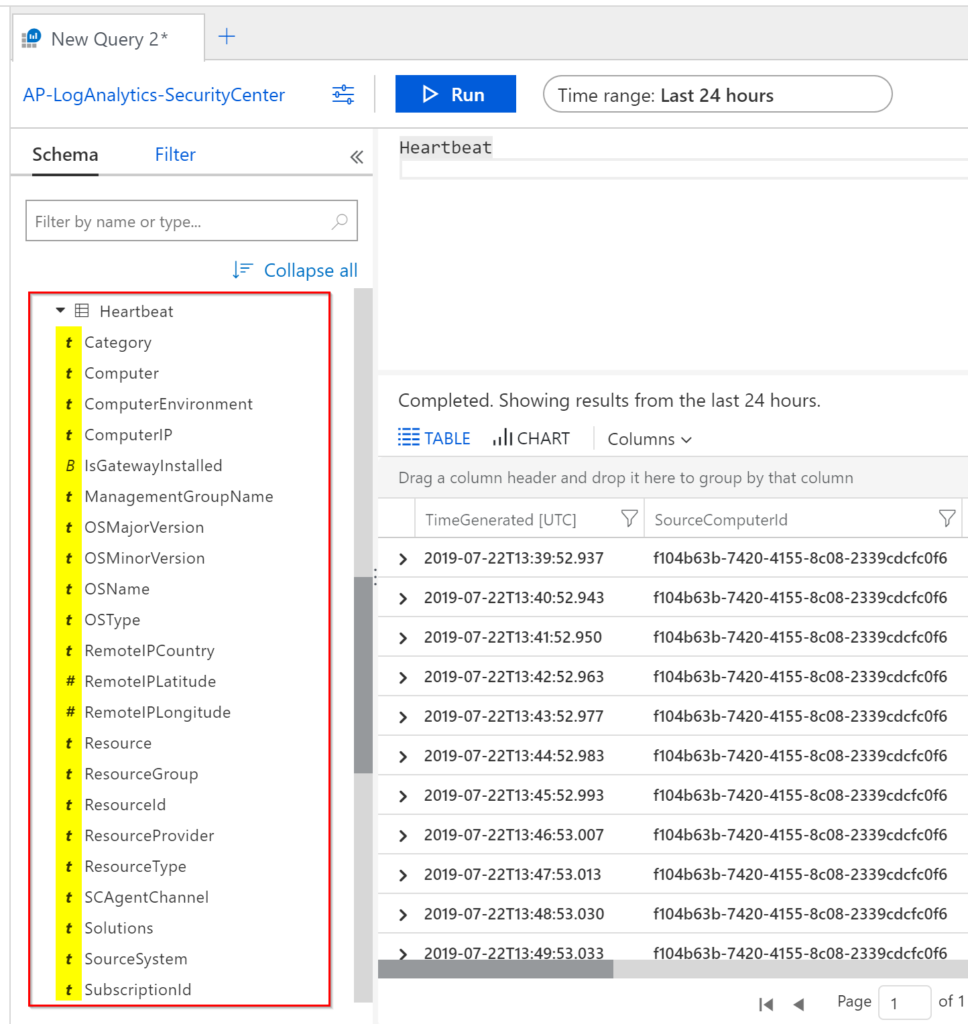
The second method to see what we have inside of any given table is expanding the Schema area, a list of every single file will be displayed. The first icon (highlighted in the picture) will provide you with the data type (bool, datetime, guid, dynamic, int, long, real, or string). Note: When we go to a more advanced Log Analytics article (spoiler alert!), we will see other methods to check the data type without looking at the schema.
At this point, without typing one single stroke on your keyboard, you were able to retrieve all VMs that are reporting to this Log Analytics workspace in the last 24 hours. The information in there may not be the nicest report that you have ever seen, but we have something.
Fine-tuning your first Log Analytics query (no experience necessary)
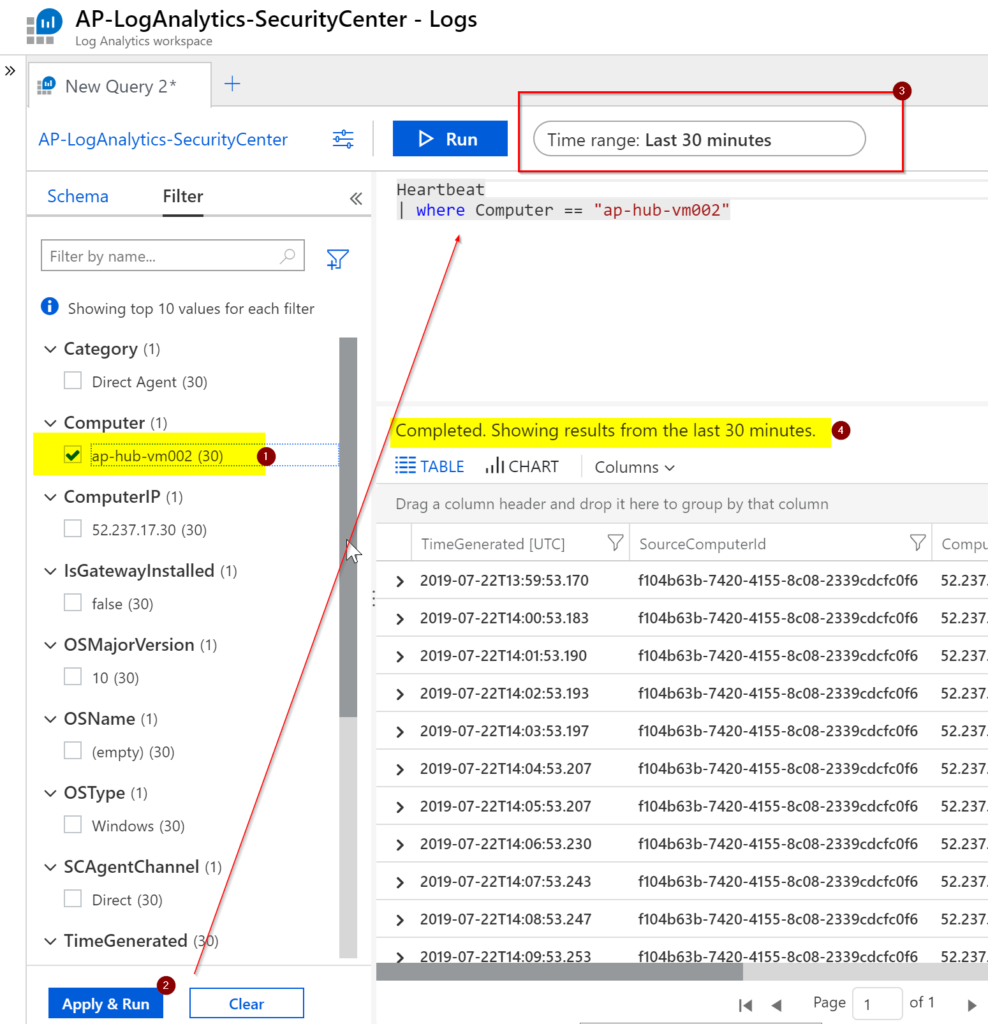
Let’s imagine that this workspace is being used by tons of VMs, and our previous query would return zillions of records. Having such a scenario, we may want to narrow down the results to a specific or a small subset of VMs. Is it time to get our hands dirty and start typing? Well, not yet 😊. To do basic filtering, click on the Filter tab, and Logs is smart enough to provide all fields/values for that specific table that we have on the right side. We can easily select which value we want from Computer (in our article the VM ap-hub-vm002) and click on Apply & Run. You will notice that the query now has a new line | where Computer == “ap-hub-vm002”, which was populated based on our decision on the Filter tab. There is more information that is useful for us on the Filter tab, where we have those numbers beside the fields and values. In a single glimpse, we know that we have a single computer (number 1) in the Computer field and that the specific machine (ap-hub-vm002) has 30 entries (in the last 30 minutes).
Another important thing in a query is to filter by time, and the Time range helps on that front (Item 3). We can narrow down the results based on time. In Item 4, we can see the results of the query based on the time that we selected. Note: It is important to note that the Filter tab is dynamic and the Time range impacts the numbers that we see on this tab.
Generating a report
We can improve our end-user experience by defining which columns we want to see. There are different ways to do that. One of them is using the project, which is not the goal in this article. Click on Columns and select the ones that are important on your report.
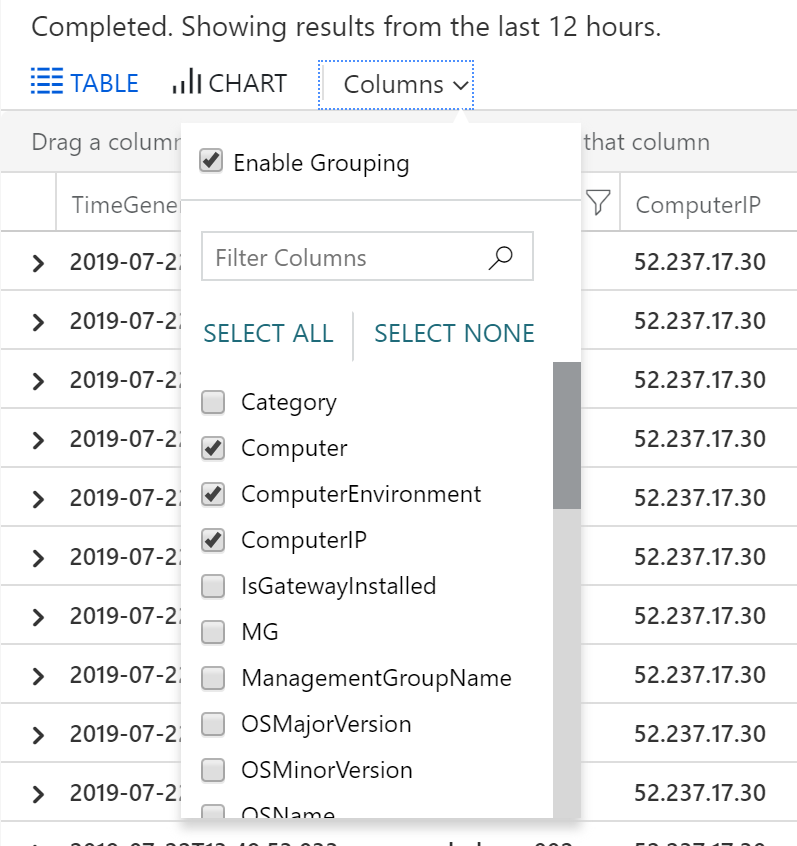
The result will be a better view of the information containing only the columns that you selected, as depicted in the image below.

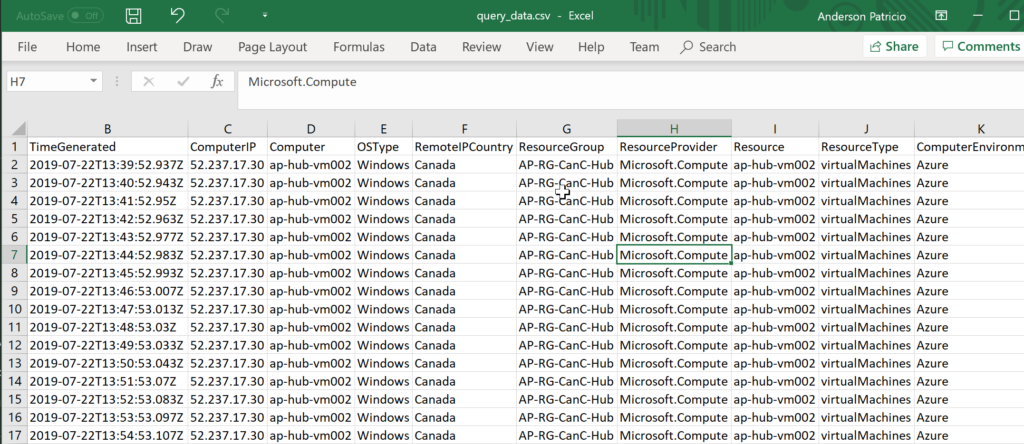
Time to generate a CSV file. Click on Export, and then Export to CSV – Displayed Columns. The result will be a file available for download. Open it in Microsoft Excel, and you will have only the columns that you selected.
We achieved the goal of this article, which was to create, narrow down, improve the output and generate a file from data stored in Log Analytics. We haven’t really scratched the surface in Log Analytics, and when we use the keyboard, we have tons of functions to use to improve and refine our search.
Featured image: Shutterstock