It is imperative for the cloud administrator to be in control and understand what is going on in the Microsoft Azure environment for operation, security and infrastructure purposes. Being able to track every resource activity and identify who, what, and when an activity was performed helps any size organization to manage and control their cloud environment. All modifications performed at the Azure infrastructure level are recorded on the activity log in the ARM (Azure Resource Manager) mode, and all that information can be stored in a storage account, moved to a third-party solution using Event Hub services, OMS. The same information can be retrieved using Azure Portal, RestAPI, PowerShell, and CLI interface.
The activity log integrates with Alerts, which allows a notification to be generated when a predefined action is triggered. The notification can use any of the supported channels defined in the Action Group (webhooks, SMS, email, voice, Azure app, and so forth).
When the topic is logging/diagnostics, we have two main areas: control plane, where all activities on the ARM (Azure Resource Manager) are logged and can be retrieved, and data plane, which are the logs generated by the resources and/or services.
A good example to describe these areas can be summarized in these following scenarios:
- A user creating a Key Vault. That will generate an entry on the management plane.
- A specific secret being deleted from the Key Vault. That will generate an entry on the data plane.
- Creation of any new resource (storage, VM, load balancer, you name it) will trigger an entry on the management plane.
- Logs generated from a VM (metrics. for example) are part of the data plane.
Using Azure Monitor
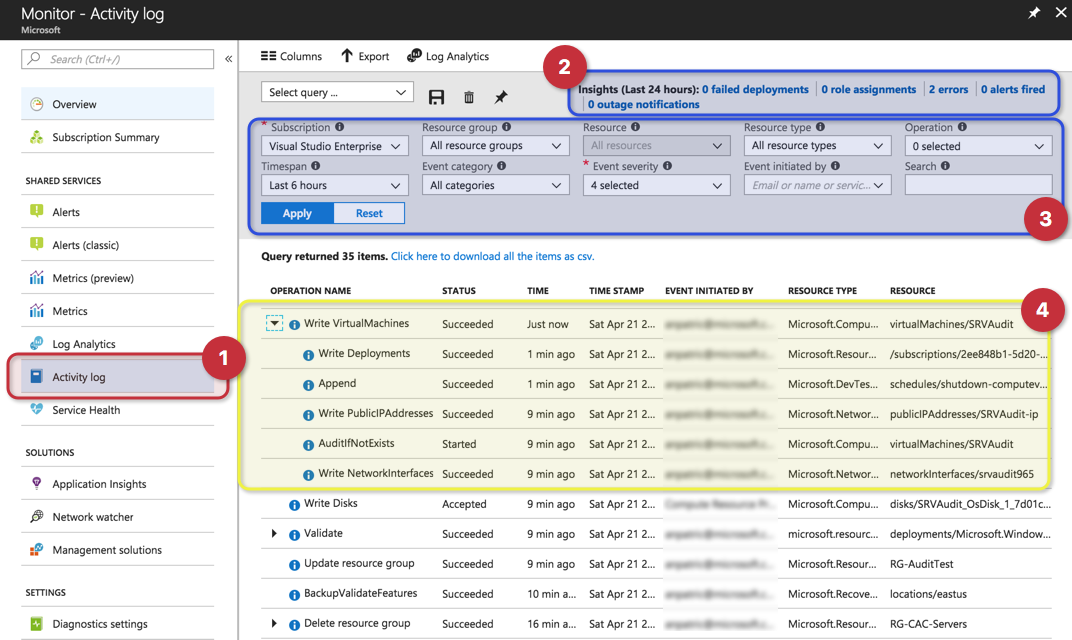
The activity log is part of the Azure Monitor. To access it, search for Monitor or select from the left side menu, and then on the new blade click on the activity log (item 1, below). In the new blade, we have a lot of components that we must be aware of before we can use the activity log:
- Insights (last 24 hours) (item 2): There are links for deployments, role assignments, errors, alerts fired, and outage notifications and by clicking on those links the query underneath will be automatically updated and the results will be seen in the results area.
- Query section (item 3): In this area, the sky is the limit and we can play around with the variables to narrow down our queries for what is important for us. We can adjust timespan, type of operation, severity, resource group, resource type, subscription, and search a string. Note: Make sure to hit Apply after modifying your current query.
- Results (item 4): this area contains all the results from the query defined above. The results will show useful information to pinpoint who, when, and what any given action was performed in Azure infrastructure. We can always add and remove columns by using the Columns button (located at the top). In the example below, we have a new VM being provisioned, and we can see the creation of PublicIPAddress, who performed the creation of the VM, what type of resource (network, compute, DevTest, and so forth), and the resource itself.
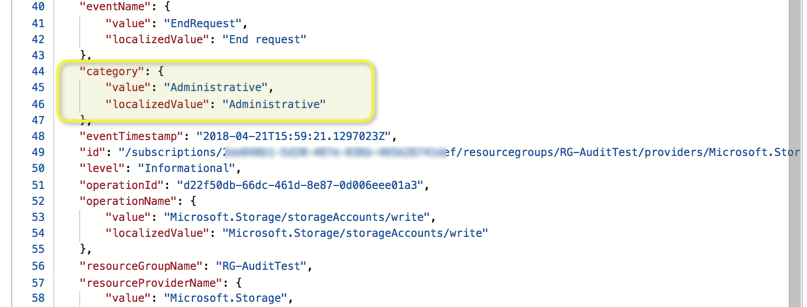
When we click on any of the entries below, we will have a brief summary containing the operation name, timestamp, and the event initiated by. However, we have the option to explore in detail what went on by clicking on JSON, which will provide additional information.
In the example below, we can see the category of the event, which is Administrative, and we can see that a storage account was created within the RG-AuditTest resource group.
Note: Knowing the category of the event helps during the Alert creation.
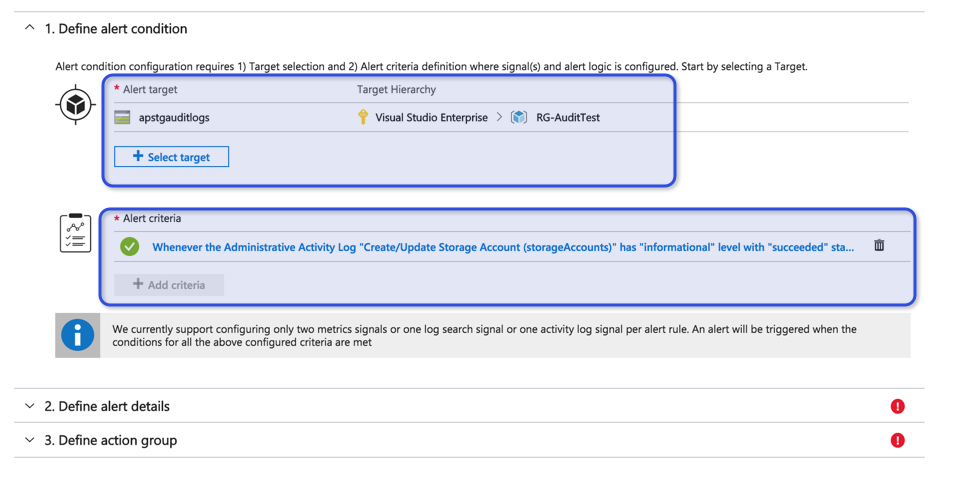
In the same location, we have an option to create an alert. Click on the Add activity log alert link, which is located above Summary/JSON lines, and that will move to the Alert service with the Define Alert condition section already filled out with the information of the activity log entry that we were using.
Keep in mind that the alert being generated is based on a specific entry. You may want to change it to be more generic, for example, to comprehend all storage accounts (alert target area), and also remove a specific user account (by default, the alert criteria will generate an alert when the same user from the entry executes the same task).
Another nice feature when using the activity log is the ability to save queries. Let’s say that we created a query in the main blade that narrows down only the VM provision and updates. We can always click on the Save button and associate a name for that query. In the future, we just need to select the query from the drop-down and the query will be updated to match the saved query and the desired results will start being displayed in the results area.
Using Activity Log at the resource level
The activity log is also available in the vast majority of the resources. When selecting a resource (load balancer, storage, virtual machine), you will notice that the Activity Log item will be underneath Overview, and when we select it, we will have the same blade when using Azure Monitor, however, it will have the resource group and resource already pointing out to the current resource that we are exploring.
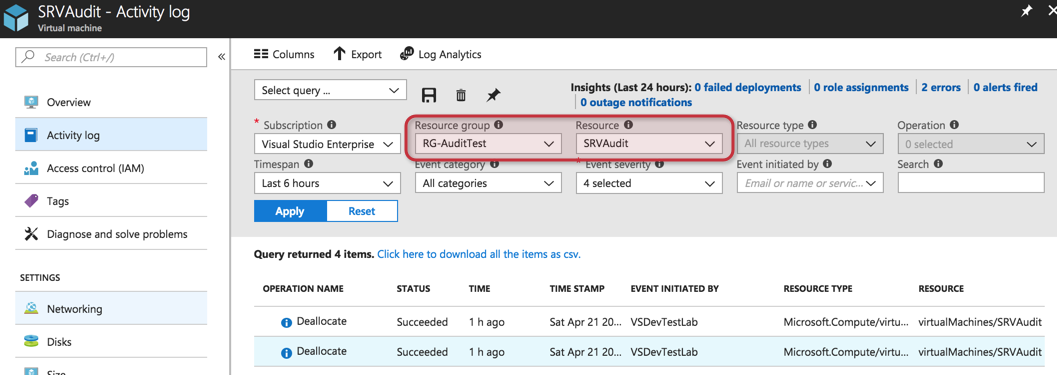
If you want to check what is going on a specific resource, this is a simple and efficient method to narrow it down automatically without typing and selecting resource groups and resources using Azure Monitor.
Archiving activity log information
By default, all activity log information in Azure is kept for 90 days, and if there is a need to keep for more time, than the data must be stored in a storage account, OMS, or moved to a third-party vendor using event hub service.
Before configuring the archive, we must create a storage account. For security reason, it is recommended to use a storage account in a different subscription.
To archive the activity log in a storage account, click on Azure Monitor, and then Activity Log, and click on the Export button located at the top of the blade on the right side. In the new blade, define the regions that you want to collect the log activity and check the option Export to a storage account, and select the desired storage account from the list, and finally define the number of days to retain that information. Click on Save to finish the configuration.
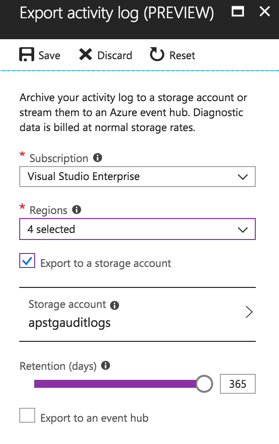
The results will be a container called insights-operational-logs in the Blobs section of the defined storage account.
Auditing and security
The activity log is the final destination for auditing and security for your Microsoft Azure environment and improves operations and security practices. It shouldn’t be taken lightly, and proper planning where to store the information and what type of integration is required to use with your current solution (if you have any) must be considered as part of your Microsoft Azure adoption.
If you use a SIEM system or any other process to analyze log information either on-premises or in the cloud, make sure to check with your vendor and their roadmap to support Microsoft Azure and event hubs integration.


Hi Anderson,
Just a question: from your prospective, does it make any sense for Azure admin to have a tool to search directly through the archived activity logs on the blob storage, without uploading them to another system? Like shown here: https://www.youtube.com/watch?v=b19PJgDDENU Please, advise.