Microsoft 365 provides numerous tools and applications designed to help the users within an organization be more productive. Even so, users are sometimes reluctant to embrace new technologies. As such, Microsoft has created a new feature called the Productivity Score that can help you determine how various Microsoft 365 technologies are being adopted throughout the organization.
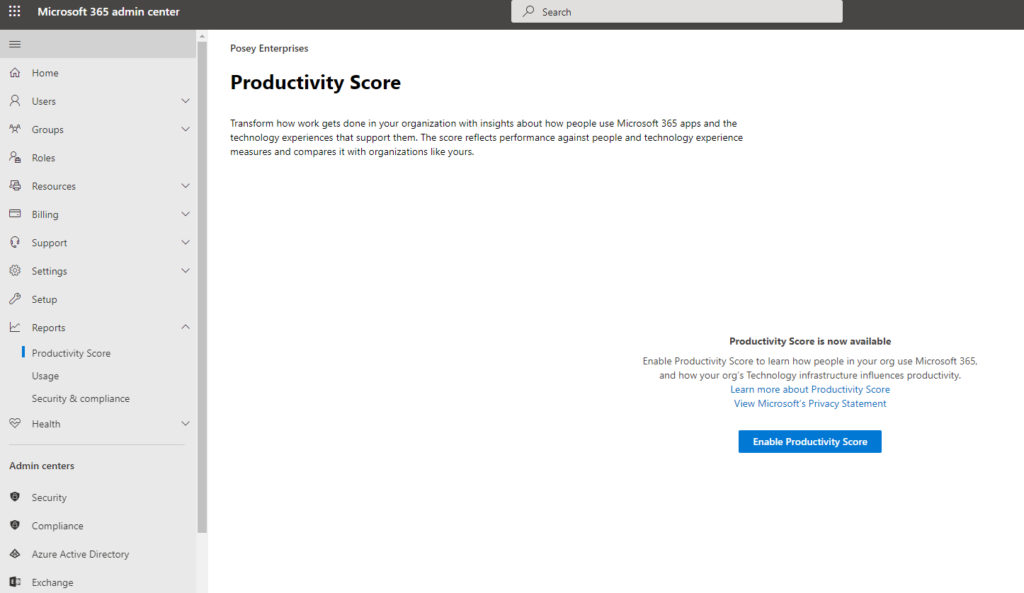
You can access your organization’s Productivity Score by opening the Microsoft 365 admin center, expanding the Reports section, and clicking on the Productivity Score option. Unfortunately, the Productivity Score is not enabled by default. You will need to enable the Productivity Score for use by clicking on the blue Enable Productivity Score button shown in the figure below. Once enabled, it can take up to 24 hours for the Productivity Score to be displayed.
The Productivity Score itself is displayed on a dashboard alongside several different charts. These charts are grouped into two main categories – people experiences and technology experiences.
The people experiences include Communications, Meetings, Content Collaboration, Teamwork, and Mobility. The technology experiences include Endpoint Analytics, Microsoft 365 Apps Health, and Network Connectivity.
The people experiences
The people experiences are based around the idea that users within your organization will ultimately be more productive if they choose to embrace the various Microsoft 365 capabilities. Microsoft has defined five areas (mentioned above) that tend to reflect whether users are getting the maximum possible benefit out of Microsoft 365.
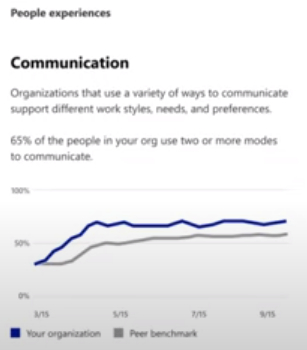
The first of these areas is Communication. The idea here is that in any organization, users communicate with one another in a variety of ways. Consider offline communication, for example. A user might pick up the phone and call someone or simply walk over to the person’s desk. Similarly, the Communication Score indicates the percentage of Microsoft 365 users in your organization who use two or more modes of communication within Microsoft 365.
As you can see in the figure below, the communication score is shown as a trendline. The same also holds for all of the other people experiences and technology experiences. This trendline shows how the use of the various capabilities is evolving. You might notice in the screen capture that there is also a great trendline beneath the blue one. The great trendline reflects what Microsoft refers to as a peer benchmark. It’s essentially a way of gauging the trend across other organizations. The idea is that you can compare the trends within your own organization against those of other organizations.
The next element shown within the people experiences is the Meeting Score. The Meeting Score is essentially an assessment of the degree to which your organization’s users are using online meeting tools. The score itself indicates the percentage of your total users who are following one or more best practices for online meetings.
The third score that is given within the people experiences is the Content Collaboration Score. As you would probably expect, the score reflects the percentage of users within your organization who actively collaborate using online files instead of simply emailing documents back and forth.
The fourth score that is compiled as a part of the people experiences is the Teamwork Score. The Teamwork Score shows you the percentage of users who are contributing to a shared workspace.
Finally, the fifth element of the people experiences is the Mobility Score. This score tracks the percentage of users who are accessing Microsoft 365 resources across multiple device platforms. The assumption seems to be that if a user is accessing corporate resources from multiple device types, then that user is presumably getting work done while in the office and while on the go — hence the reason why the score was named mobility.
Technology Experiences Score
Three metrics are used to compile the overall Technology Experiences Score. The first of these metrics is Endpoint Analytics. The Endpoint Analytics score tracks device startup time as compared with an industry benchmark. The idea behind this score is that users are less productive if they have to spend a lot of time waiting for their devices to boot. A low Endpoint Analytics Score might be used as justification for a PC refresh.
The second of the technology experiences metrics is the Microsoft 365 Apps Health Score. Oddly, the score actually has little to do with health. Instead, the Microsoft 365 Apps Health score tracks the version of the Microsoft 365 apps that users are running. Users who update to the latest version are arguably more secure and have access to the latest features, so Microsoft tracks the percentage of users on a recommended update channel.
The third and final technology experiences metric is Network Connectivity. As you undoubtedly know, Microsoft 365 applications such as Exchange Server, SharePoint, and Teams cannot function without network connectivity. Microsoft keeps track of the quality of users’ connections to Exchange. This can help you assess your network’s overall health, but if a user experiences poor connectivity while working from a mobile device on the go, that user’s experience can skew the score.
Microsoft 365 Productivity Score: A tool you should be using
The Microsoft Productivity Score can be a great tool for determining the extent to which users are embracing the technology that is available to them and participating in your organization’s overall digital transformation efforts. At the same time, the technology experiences can help you get a better feel for underlying issues that may be adversely impacting end-user productivity.
The interesting thing about these metrics is that because they are plotted on a trendline, you have the ability to observe changes over time. This means that if the IT department takes some action, such as upgrading the network or providing end-user education, you will use the trendline to measure whether that action had a quantifiable positive impact on the organization.
Featured image: Designed by Fullvector / Freepik