Microsoft Azure introduced a new service called Service Map, which is a great tool because it is able to map all communication flow to and from a monitored server. This is, obviously, very useful for security professionals and support teams. The communication flow includes traffic between servers, processes, and ports. As long as you have the agent installed on the VM, all traffic in and out will be tracked and stored in the OMS Workspace.
Having this kind of service in your environment helps in several cases, such as patch management, transition, discovery, security, and incident management. Knowing all the communication of any given server or group server helps in the planning and changes in any environment.
The cloud administrator must be aware of some details of this service. Some of the key points are:
- The solution is currently available in five regions: East U.S., West Europe, West Central U.S., and Southeast Asia.
- The tracking occurs on TCP connections. A single agent is able to capture all traffic in and out of any given VM.
- It supports only 64-bit operating systems.
- It does support Windows (2008 R2 SP1 and later versions, and desktop OS of Windows 7 and later) and Linux (tons of flavors and versions).
- There is a small footprint of memory and CPU (something like 0.1 percent) in the agent.
- It is expected there will be a 25MB traffic between the VM and the workspace in a single day, and the data is sent every 15 seconds
Creating your first Service Map
The Service Map service requires an OMS workspace and it can be added to an existent one or a new one can be created. One of the methods to create your first Service Map is by clicking on New Resource in the Microsoft Azure portal, and then typing in Service Map. Select the Service Map from the list (just to be sure, it is from Microsoft under Management Tools category).
In the new blade, a summary of the service will be displayed. Click on Create.

In the new blade, we can select an existent Workspace or create a new one. After making your selections, click on Create. The result will be seen under the Solutions item in the workspace.

Configuring a Windows Server to use Service Map
All machines that will be part of the Service Map require two agents: Microsoft Monitoring Agent and Dependency Agent. We can take advantage of Azure Automation to install that automatically (which is going to be a topic of a separate article.) There are several ways to accomplish this task. One could use a RunBook or a DSC (desired state configuration) and both are available using Azure Automation.
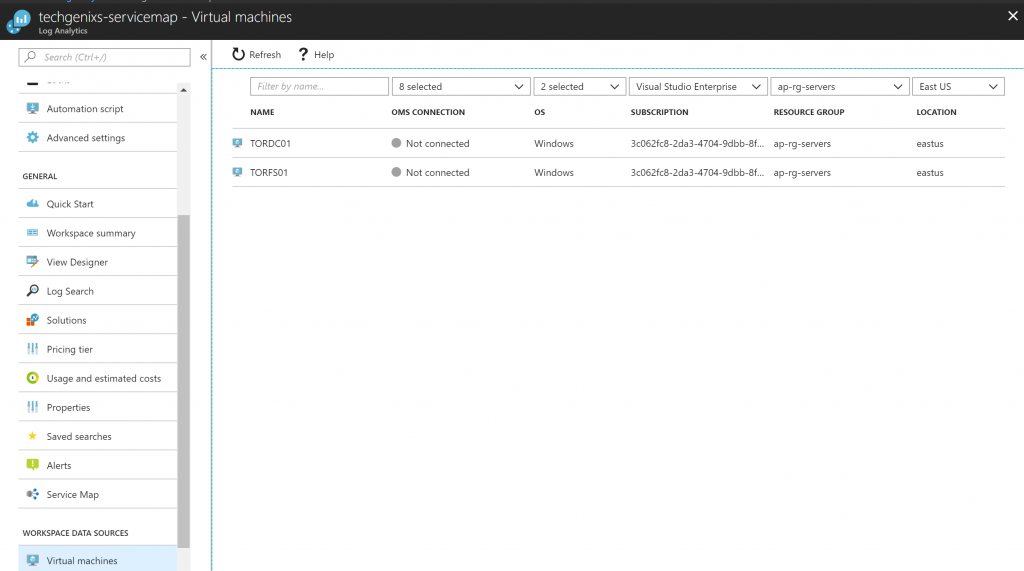
In this article, we will install manually but we are publishing a script to connect any VM with a workspace. Logged on Azure Portal, open the Log Analytics that is going to be used for the Service Map, click on Virtual Machines item under Workspace data sources, and a list of VMs will be listed on the blade that will be displayed on the right side.
Select the desired VM, and on the new blade, click on Connect. This process will install the Microsoft Monitoring Agent (MMA) on the desired VM, and that is the first step required for the Service Map.
The second step is to install the Dependency Agent on the same VM. There are a couple of ways to find the latest version of the agent. We can get it from the documentation from the Service Map page located within the Log Analytics or use this one for Windows or this one for Linux.

The installation process is simple. Just click on I agree on the initial page, and that’s it. We just need to complete the process by clicking on Finish on the last page.
This process will install the Microsoft Dependency Agent service in the VM, as depicted in the image below.

Using Service Map
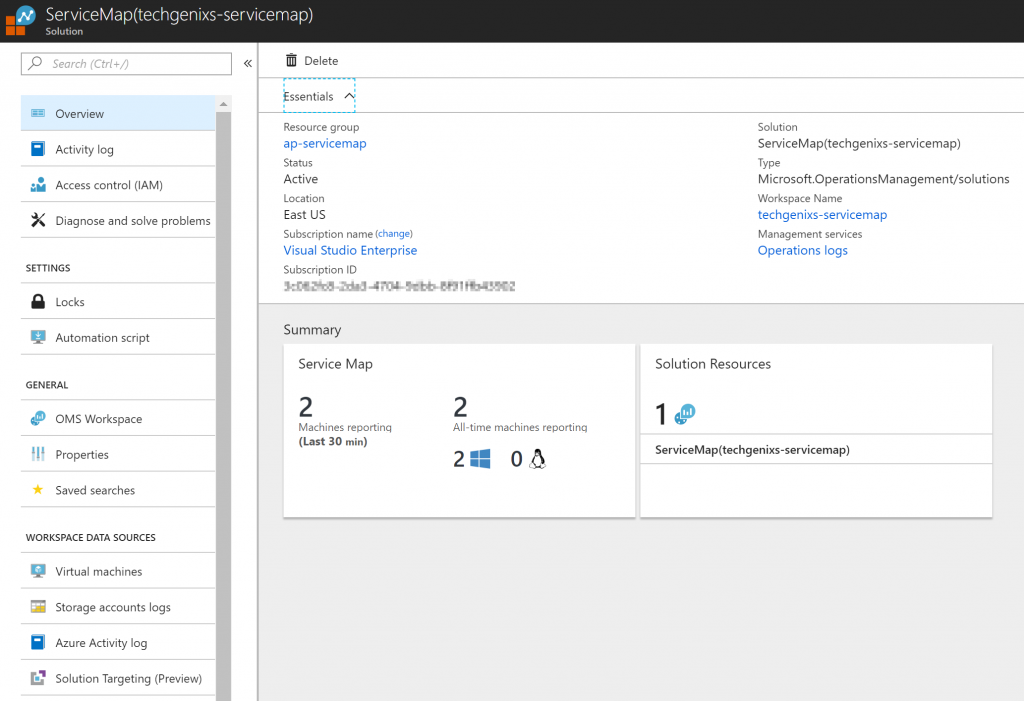
Now that we configured the clients to report their data to Service Map, there are a couple of ways to use the service. Open the Log Analytics/Workspace that we defined/created to be used with Service Maps in the Azure Portal, click on Solutions, and click on Service Maps item located on the right side.
In the Overview item, we will see a brief summary of the solution and in the Summary section we can see how many agents are reporting in the last 30 minutes, and the total of VMs that have reported to the service, the last one shows the number of VMs per operating system (Windows/Linux). Click on that box to explore the Service Map service.
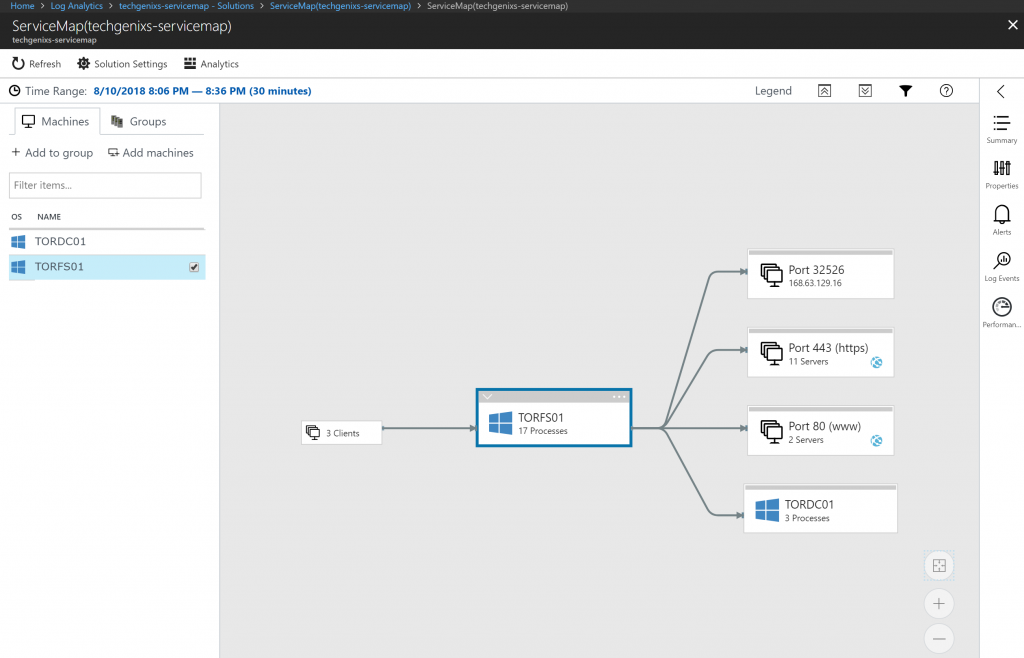
That is the main page and where all the action will occur. Select a VM from the left side and on the map. We will have right out off the bat the VM and the communication flow of that VM. We can see that there are some clients accessing some services of that VM, and the VM is using ports 32526, 443, 80 to communicate with other parties, and also some communication going on with TORDC01 (which is the Domain Controller).
More to come
There is so much more to cover in this area that we will have an article just for that! Stay tuned for the next article about Service Map here at TechGenix.
Featured image: Shutterstock


Thanks man, appreciate the detailed info!
I am planning to use Azure service map to identify the dependencies of an application.
I am planning to move the Application from on Prem to cloud.
So before migration I am looking to identify the dependencies of the application using Azure service map.
But the database of that particular application is hosted on a shared consolidated database.
The consolidated database means, the same Database server hosts DB for multiple applications with multiple database instances
So if i use Azure service map agent on the database server, it will be receiving multiple requests from different servers & I will not be able to identify & differentiate the requests. I will not be able to really identify the dependency for application with respect to Database.
Is there any work around or any way by which we can address this
Hi,
I followed this steps that you have mentioned, but my VM is not listed under service map.
I opened my VM and navigate to insight there it says as below.
——————————————————————————–
There is no mapping data for the machine in the requested timeframe. If this persists, please refer to our FAQ for assistance.
——————————————————————————–
Please help.
Thanks