Product Homepage: click here
Free Trial: click here

I have worked with several monitoring solutions available in the market. Though there are many available to monitor your IT infrastructure, many have limitations and are not so intuitive. I have seen some products that can only monitor Windows computers and specific components and are very complex to use. While other monitoring products can monitor both Windows and Linux operating systems, they require an agent to be installed on the target systems. NetCrunch v10.6 from AdRem Software, however, provides a complete solution to monitor the entire IT infrastructure of an organization. NetCrunch v10.6 has added a bunch of new features that we will examine as part of this review.
Considerations when choosing a monitoring solution
When it comes to providing recommendations for an IT infrastructure monitoring solution, there are several important aspects I always take into consideration as you can see in the list below:
- Whether the monitoring solution is simple to set up and manage.
- Is the solution is capable of monitoring non-Windows operating systems and network devices?
- Does it provide mechanisms to discover devices and allow you to quickly scan through networks?
- Can it monitor devices without installing a monitoring agent?
- Does it provide built-in mechanisms to recover from disasters quickly?
- Does it provide role-based management?
- Whether it provides a built-in database to store monitoring data for reporting and other purposes.
- Are issues identified and fixed quickly?
- Does the monitoring solution provide the capability to monitor all network services and sensors such as WMI, cameras, SQL, Radius, and so on?
- Does the monitoring option provide support for languages other than English?
NetCrunch v10.6 provides all these capabilities in one product as shown below:
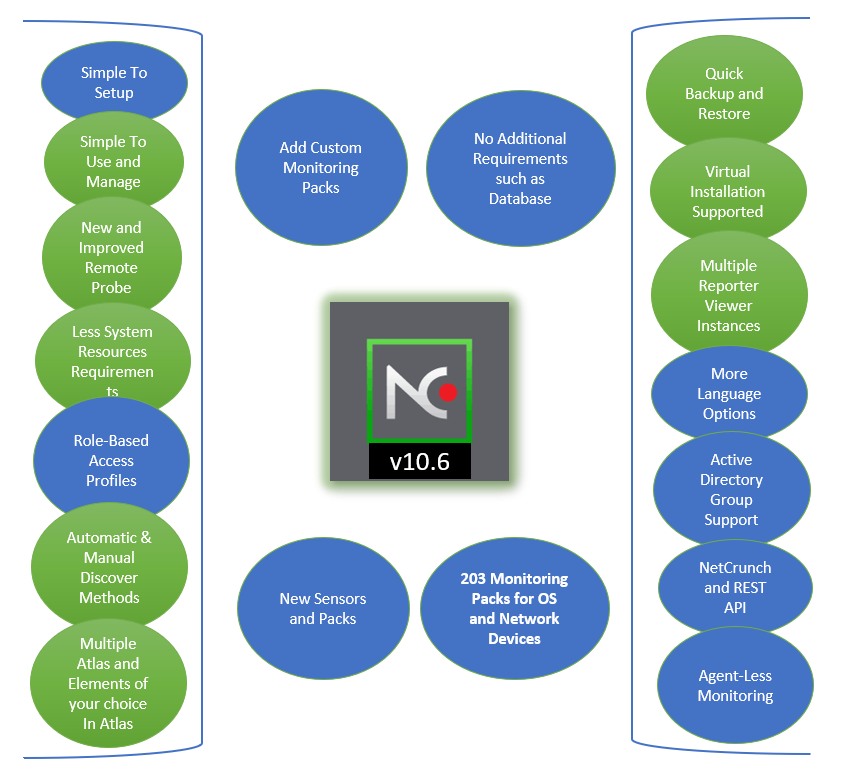
As you can see in the above graphic, NetCrunch v10.6 provides all these capabilities and helps you locate any device on your network and monitor them. It not only has built-in rules configured to monitor the components but also provides the ability to fine-tune monitoring packs to suit your requirements. Though NetCrunch provides 203 built-in monitoring packs, you can add more for a specific component from within the NetCrunch console. There are many different scenarios supported by NetCrunch v10.6. It can collect event logs including Windows Event Logs, Syslog, SNMP traps, and performance counters. The data collected by the NetCrunch server is processed to generate the alerts in the NetCrunch administrator console.
The product ships with a configuration UI, which is much more flexible than any other monitoring solution I have seen. NetCrunch v10.6 provides some new features as listed below:
- New monitoring packs: 203 monitoring packs for operating systems and network devices.
- New sensors: New sensors for Microsoft ecosystems and network devices.
- Language support: NetCrunch extended its support for more languages to German, Japanese, and Polish.
- REST API: NetCrunch REST API is an impressive feature that enables you to get information, remove and modify nodes, views, folders, policies, and even sensors. You can configure HTTP protocol with languages like cURL, Python, and JavaScript.
NetCrunch v10.7
While the review focuses heavily on NetCrunch v10.06, the upcoming release of NetCrunch 10.07 includes new features as listed below:
- New monitoring packs: The AdRem development team has added new monitoring packs such as CyberPower environment packs that can help inform you about values gathered from humidity and temperature sensors, IronPort packs that can help in monitoring a system, disk and queue utilization of email security devices.
- Hyper-V grid views: A new tab has been added in the NetCrunch console specifically for Hyper-V. For Hyper-V virtualization hosts you can see information about Hyper-V hosts and virtual machines running on them.
- Text data parser with Python: Now NetCrunch v10.7 supports Python scripts. It is possible to create data parsers and text parsing expressions and test the scripts on the fly.
- More WBEM sensors: Web-Based Enterprise Management is a widely used technology. The AdRem development team has implemented three more WBEM sensors that can connect to WBEM-capable systems using HTTP/SOAP protocol and fetch the required information.
- More resilient and scalable: NetCrunch v10.7 brings some architectural changes that make it a more resilient and scalable monitoring system.
- Other improvements: NetCrunch v10.7 also brings other improvements such as adding an “uptime” column for Windows machines so it is easy for you to check the uptime of critical application servers. Device type can be set so it is easy to identify the type of a device, IPSLA sensors can be tested before enabling monitoring for IPSLA sensors, Putty version has been updated to version 0.71.
NetCrunch v10.6: Easy to Install
NetCrunch v10.6 is easy to install on Windows computers. I did not have to spend much time to get it up and running. I was able to do it in just a few steps:
- Downloading the NetCrunch Server executable file from the AdRem website.
- Installing NetCrunch Server on a supported Windows operating system on either a physical or virtual machine.
- Discovering monitoring devices on my network.
Fewer system resources
The NetCrunch Server component is responsible for monitoring devices and the client component is a console used to access the configuration information. Since monitoring solutions are always busy monitoring devices, there is nothing much required except making sure you have enough RAM and processing power available on the computer where the monitoring solution is installed. I installed the NetCrunch v10.6 Server component on a Windows Server 2012 R2 with 4GB of RAM without encountering any issues.
No additional requirements or database needed
NetCrunch v10.6 ships with its own internal database that is configured automatically during the installation. During the installation wizard, you are required to provide a path for storing product files and database files. By default, the location “C:\ProgramData\AdRem\NetCrunch\10.0” is selected for storing database files. However, it is recommended to choose a separate drive for storing database files. The data collected by NetCrunch Server and its configuration information are stored in the database.
Support for virtual environments
NetCrunch v10.6 can be installed on a virtual machine running Hyper-V or an ESXi host.
Tip: AdRem recommends installing NetCrunch on a server operating system where antivirus is not running. The reason for this is because antivirus software causes a lot of I/O operations. You can always add an exclusion in the antivirus for NetCrunch processes and directories/files.
Easy to use
When you open the NetCrunch administrator console for the first time, you will be asked to change the default administrator password as shown in the screenshot below.
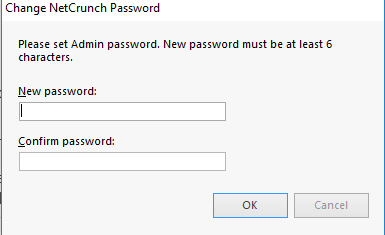
After changing the password, the NetCrunch console opens and provides you an environment to work with. Please note the password must be at least six characters in length. As I have noticed after changing the password, NetCrunch doesn’t tell you to restart the NetCrunch console. But you need to restart the console after changing the password. I waited a couple of minutes before I could relaunch the NetCrunch console from the start menu.
Console opening inputs
When you open the NetCrunch administrator console for the first time, you will be provided with a wizard that will be used to gather information about your network:
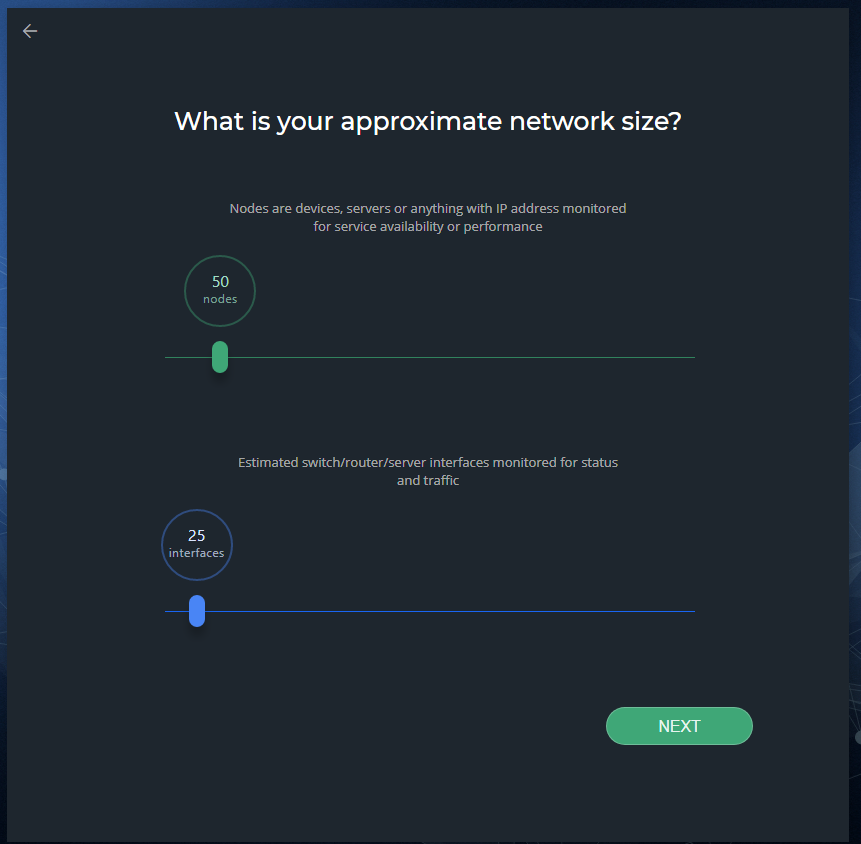
In the What is your approximate network size, screen, move the slider to the right to select the number of nodes and interfaces and then click Next. When you click the Next button, the next screen appears that shows the Network Areas as shown below.
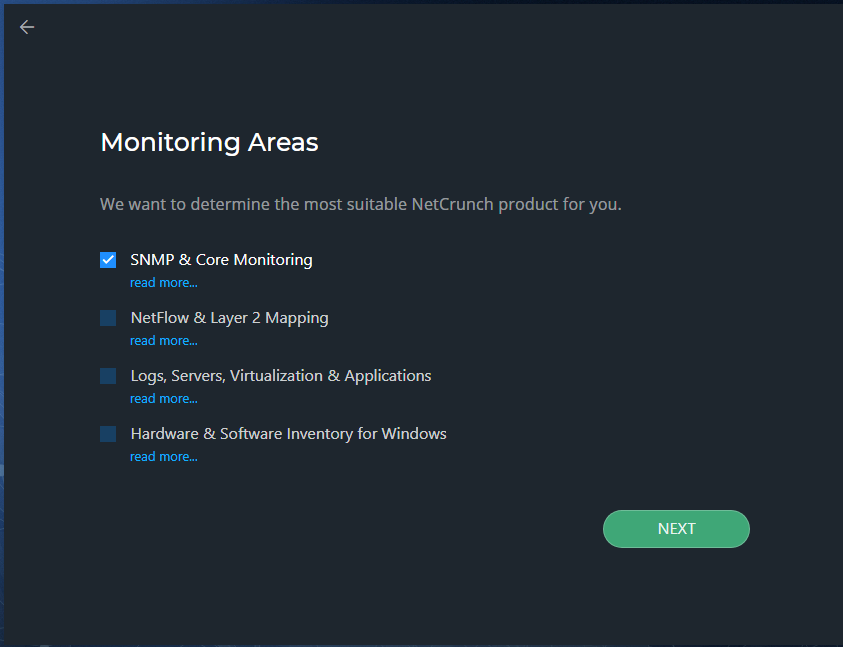
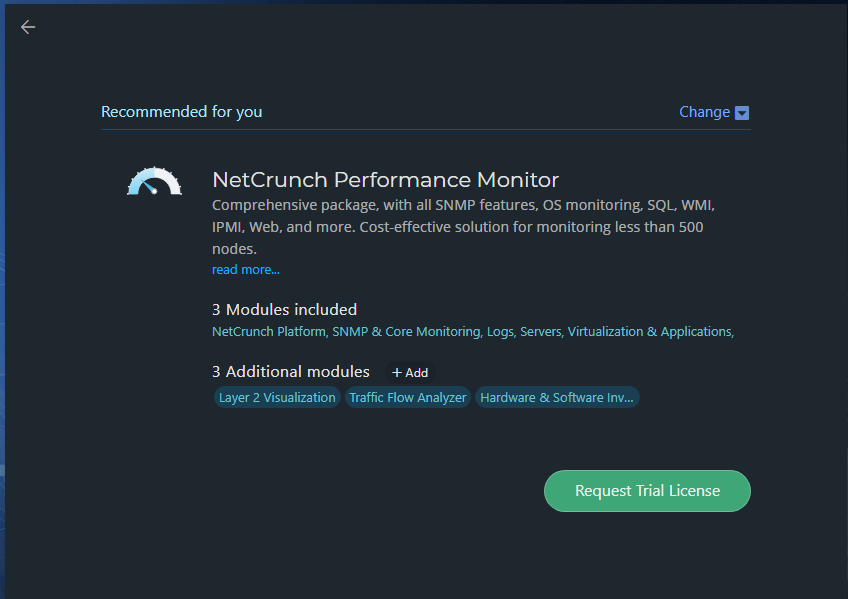
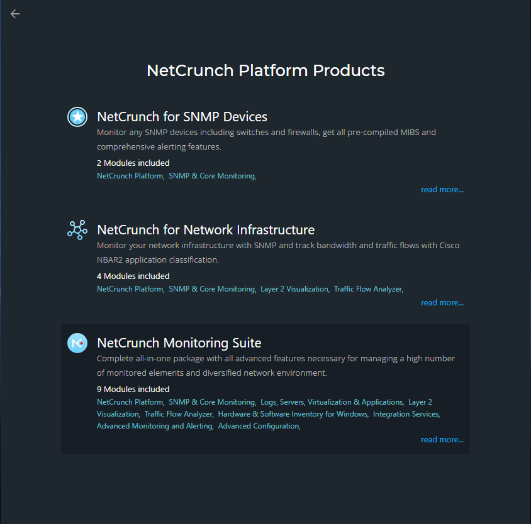
By default, SNMP & Core Monitoring is selected, but for testing purposes, I selected all and clicked Next. The next screen shows you NetCrunch Platform products. In this screen, you can select a package that meets your monitoring requirements. I selected NetCrunch Monitoring Suite and clicked Next.
Creating network atlas and discovering networking
When it comes to creating a network atlas that can scan your network, NetCrunch provides two options: scan your network or use NetCrunch simulated network. Generally, NetCrunch simulated network is used for testing purposes and to let you explore all the options available in the NetCrunch console:
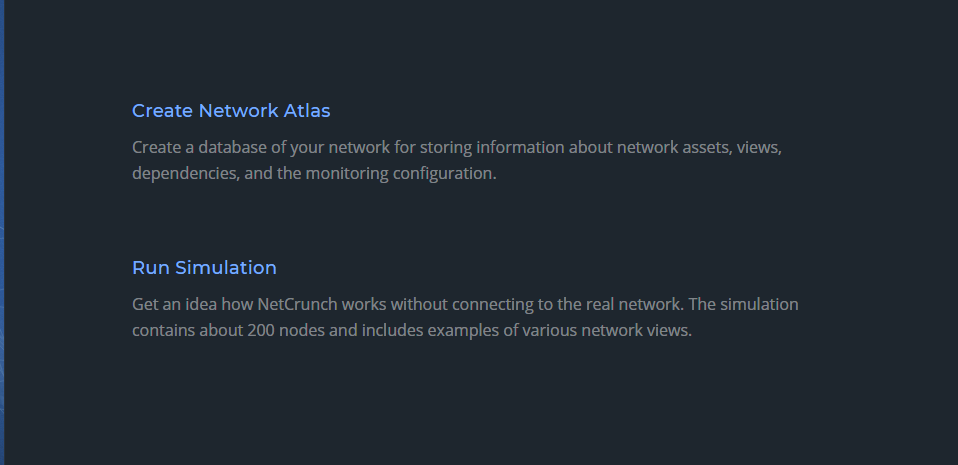
When you click on the Create Network Atlas button, NetCrunch shows a window that provides two options for creating a network atlas as shown in the screenshot below. If you click Manually, NetCrunch will create an empty database for you and then allow you to add nodes manually. On the other hand, selecting Automatically will help you discover the network devices on your network and then create a database.

In the discovery wizard, you can select to scan your Active Directory domains, network subnets, or both. Although the discovery wizard automatically adds the IP subnet based on the IP configuration of the NetCrunch server, you can also add additional IP subnets to scan as shown in the screenshot below:

Automatic and manual discover process
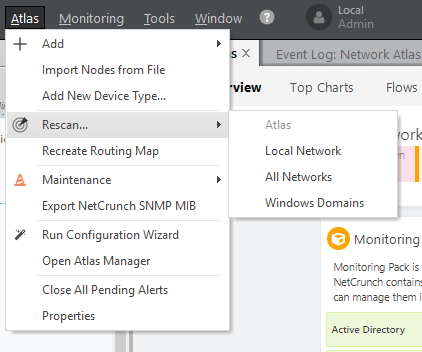
Although NetCrunch provides an option for scanning your network when you open the NetCrunch administrator console for the first time, you can always choose to rediscover networking infrastructure or Active Directory domains at a later point. All you need to do is invoke the Rescan wizard from the Actions Menu.
During the discovery wizard, NetCrunch immediately notifies you of any security risks. For example, during the discovery process, I tried to scan a public IP network (172.10.0.0), and a warning popped up notifying me that the network address is public and scanning such networks might be treated as a security violation.

Although you are required to add IP subnets manually to scan network devices on those subnets, you will be pleased to know that the NetCrunch discovery process executes a number of functions internally to create maps/views based on the IP subnets and routing information it collects during the discovery process. The discovery process also collects operating system types, inventory data, and installed software applications from the discovered devices.
Important: Since most of the environments use Active Directory domains, it would be great if you could provide an option to collect IP subnets information from the Active Directory rather than entering subnet information manually during the discovery process. Although one might think that this is a missing feature in the current version, in my opinion, not giving such an option would help you control the discovery process running for limited IP subnets. For example, you might want to monitor only servers located on specific subnets.

Maps not only helps you get the overall status of monitoring devices, but they also support the right-click context menu that provides the ability to perform several actions such as showing inventory data, troubleshooting nonworking devices, modifying node settings, and acknowledging all alerts. For example, if you need to see the inventory data for a particular device, right-click on the device and then select Inventory View. Clicking on the Inventory View action brings up the device inventory window as shown in the screenshot below:
After scanning my lab network, I saw a map of my network as shown in the screenshot below.

The inventory data helps you with a number of things such as seeing the patch status of a server, the software installed on devices, and hardware information.
Dashboard and atlas
The NetCrunch opening screen presents you with the dashboard and atlas as you can see in the screenshot below. The left pane lets you navigate through views such as local and network IP subnets, physical segments, custom views, and performance views. The right pane shows the elements for the item selected in the left pane. When browsing through individual IP subnets (local or remote) it will only show you issues with the network devices in that IP subnet. However, I wanted to see the overall status of devices located on my lab network. I did not have to do anything special to see the overall status of my devices. The default dashboard view on the NetCrunch administrator console provides you with a great network summary.
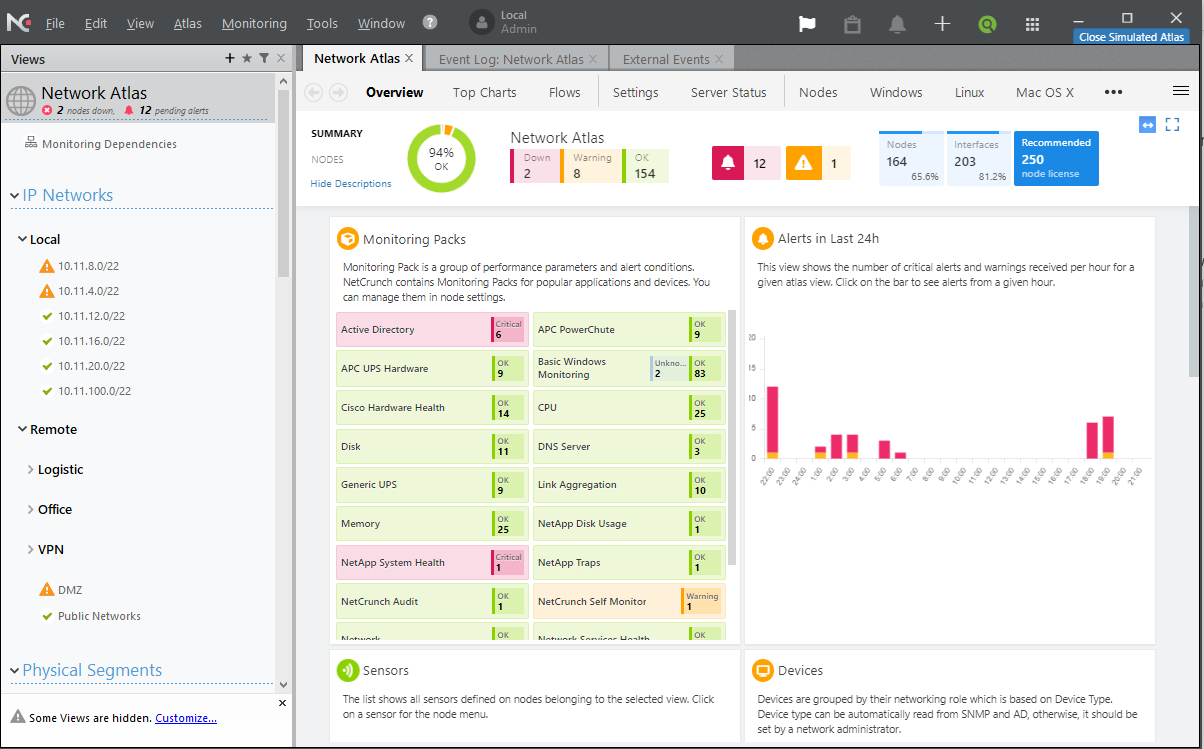
NetCrunch dashboard features
While working with NetCrunch I noticed some cool dashboard features as listed below:
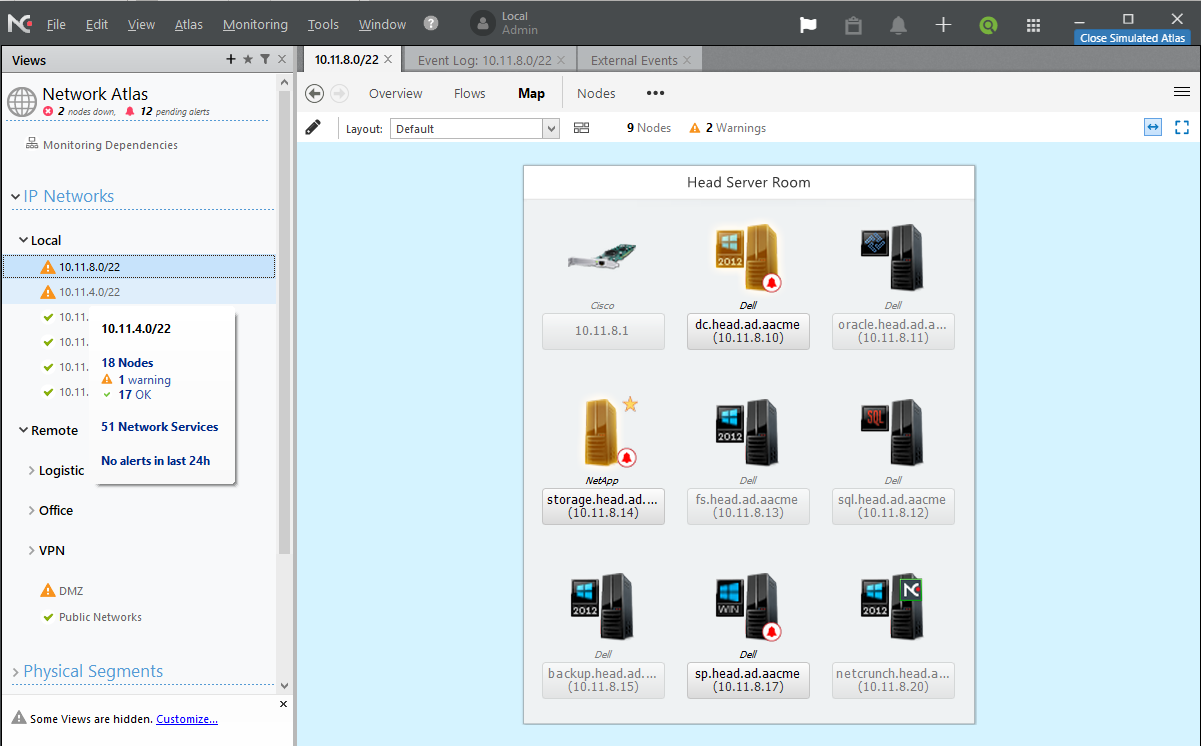
- Dashboard devices group: NetCrunch groups devices by type such as servers, Windows operating systems, network devices such as Cisco, etc. Any monitoring issues are highlighted by a red cross with the number of problem devices shown. As you can see in the screenshot below, when I clicked on IP subnet 10.11.8.0/22 it showed me the devices that are a problem as shown in the right pane of the below screenshot. When you click on any of the nodes, you will see the list of operating systems that are being monitored and the operating systems that have an error.
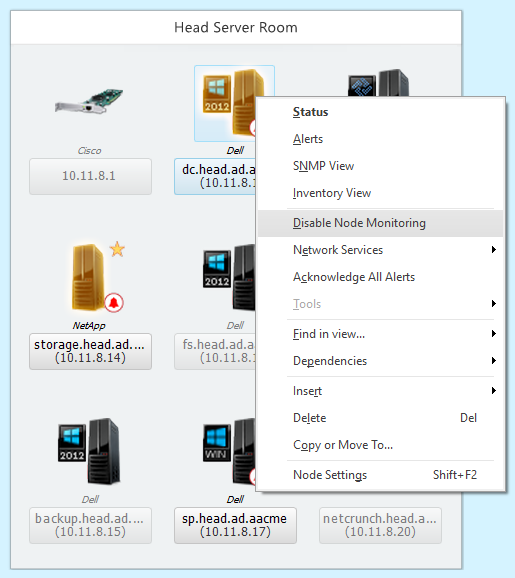
- Right-click support on devices/nodes: NetCrunch’s dashboard also supports the right-click context menu on monitoring devices. You can check device status and issues, check inventory, and acknowledge alerts by doing right-click and then selecting the appropriate options as shown in the screenshot below:
- Identifying issues quickly: The general idea behind implementing a monitoring solution is to identify any issues with nodes and devices quickly so the downtime to critical business services can be reduced. When you open the NetCrunch administrator console, you will be presented with the list of IP subnets it collected during the discovery process or any IP subnet you added manually. Since NetCrunch groups the devices by the IP subnets, it becomes easy to identify issues with the devices by scrolling through the IP subnets. The best part of the console is that it alerts you to issues with any of the devices on the IP subnets by changing the icon in the front of the subnets. If you need to know how many devices are down, how many devices are up, and how many devices are not being monitored in that particular subnet, all you need to do is hover over that subnet.
- Troubleshooting nonworking items from the dashboard: I found that NetCrunch can troubleshoot nonworking devices from within the NetCrunch administrator console.
The new status dashboard helps you understand NetCrunch server states and identify the case when a program is overloaded.
Custom views
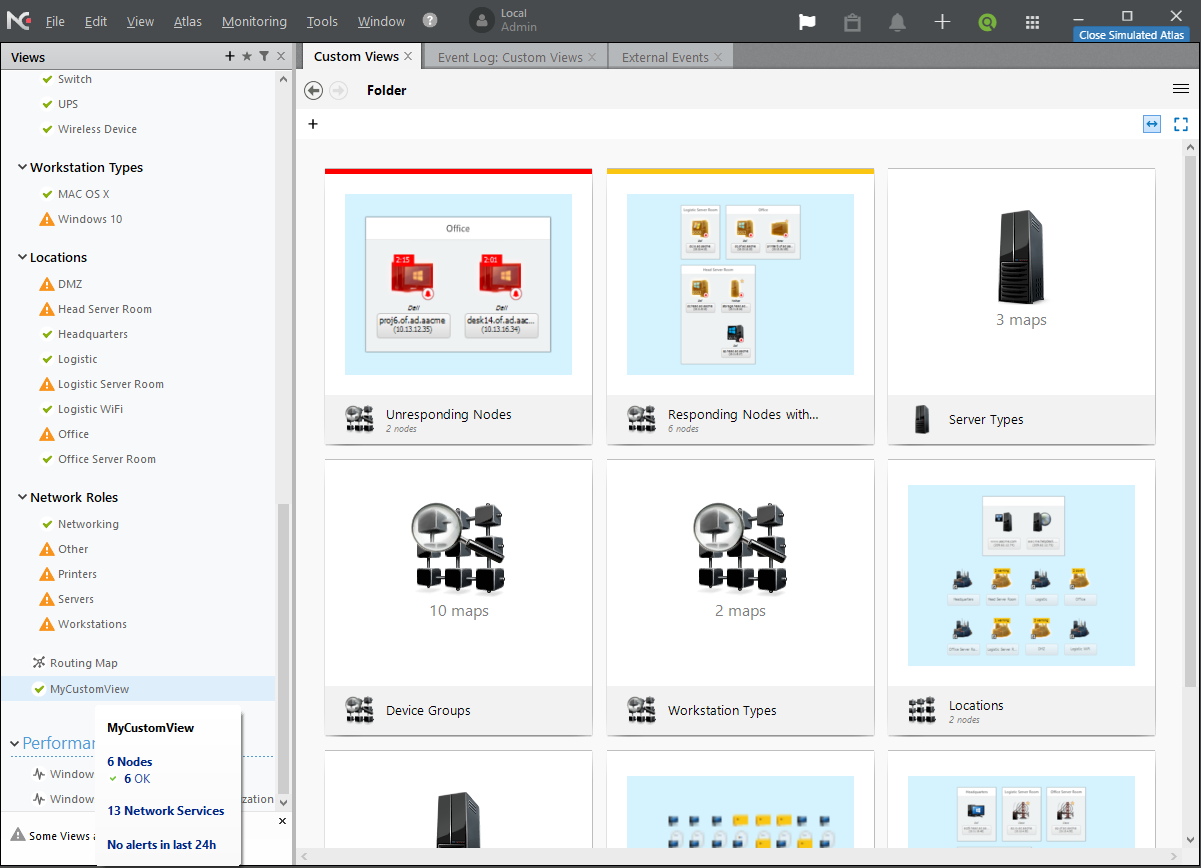
NetCrunch creates several custom views such as unresponding nodes, server types, device groups, and workstation types. Nodes and devices can be found under the Locations view. These views are created by NetCrunch and it populates the node information underneath these views. You can create your own view and link to one of the maps, servers, IP subnets, etc. As you can see in the screenshot below, I created a custom view named MyCustomView and moved all of my failover cluster nodes to that view. As you can see it shows that there are six nodes in the custom view and they are healthy, as indicated in the screenshot below.
Checking and acknowledging alerts
If you need to quickly see the alerts generated for all monitored devices including subnets, you can always navigate to the Event Log: Network Atlas tab as shown in the screenshot below and then right-click on any alert to see more information or change the alert status by going to Change > Event Resolution and then selecting resolution type:

Tip: By default, all internal alerts are correlated. One of the good things I have noticed about NetCrunch is that it knows when the alert began and when it was resolved. This is an important feature for programs receiving a correlated alert and NetCrunch takes an action to resolve the alert automatically.
Although Event Log: Network Atlas shows you the alerts for all devices in one place, you can investigate a particular device to check system resources such as memory, processor, disk I/O, and network traffic. To do so, right-click on a node/device and then click on Status action to see the details as shown in the screenshot below:

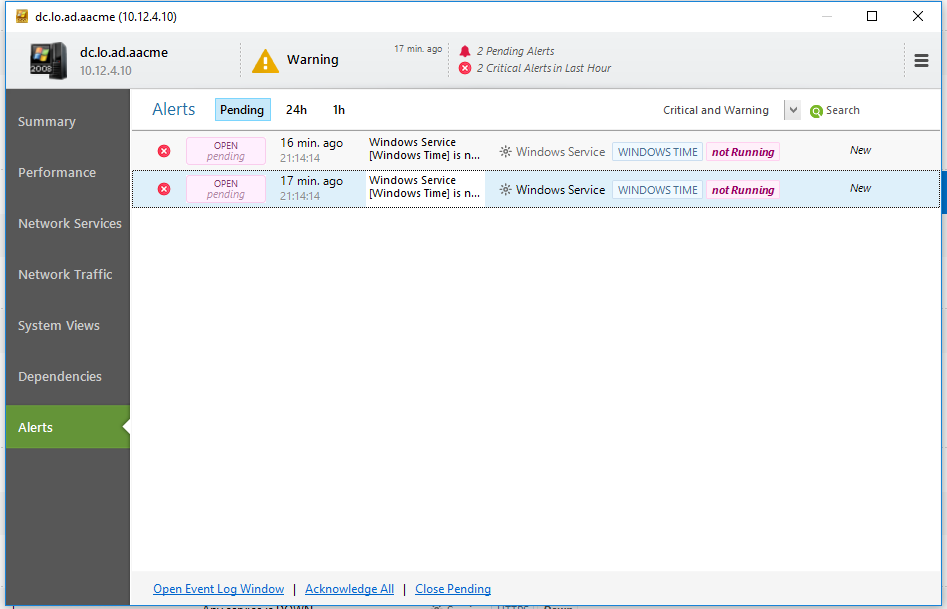
If I go to the Alerts tab, I can see all alerts generated for that particular node. As you can see in the screenshot below, it shows that there are two events related to the Windows Time Service. NetCrunch indicated that the Windows Time Service was stopped on one of my servers. This server is acting as a domain controller in my lab network and is required for authentication purposes.
Monitoring packs
NetCrunch provides flexibility in terms of what can be monitored with the help of monitoring packs. NetCrunch v10.6 ships with 203 monitoring packs containing monitoring settings for popular applications and devices such as Windows, Linux, BSD, Cisco, Solaris, and more as shown in the screenshot below:

To launch monitoring packs and policies, navigate to the Monitoring Menu and then click on Monitoring Packs and Policies. I was just checking to see as to which components can be monitored on my Windows servers, so I clicked on Windows pack and found that it has support for almost all Microsoft key components such as DNS, DHCP, Active Directory, and even Security Audit as shown in the screenshot below:

Tip: You can also create new monitoring packs and modify existing monitoring packs to suit your requirements. To create a new monitoring pack, click on an existing monitoring pack (as shown in the screenshot above) and then click on the New Monitoring Pack in the list of available packs in the right pane.
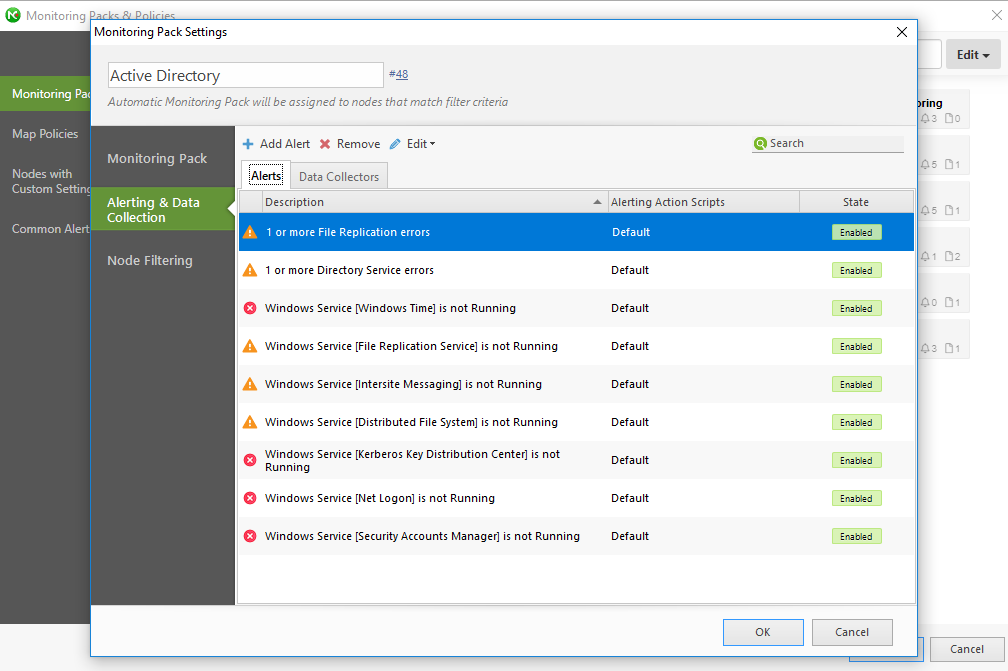
If you would like to see as to know what alerts NetCrunch can generate under a specific component, just click on the component to see the alert types. I clicked on Active Directory and could see alerts being identified as part of the Active Directory component:
Tip: The devices are automatically added to the monitoring packs based on the device type such as operating system type.
To see the list of available monitoring packs, check this link.
IntelliSearch
Although it was easy for me to get the status of a device by navigating to the appropriate nodes, I also wanted to know if I could search the device by its name and then get the status. Indeed, it was there. All I had to do is click on the search icon located in the console and then type the device name. If you would like to search a node, view, or other NetCrunch resources, you can get help with NetCrunch IntelliSearch. To launch IntelliSearch, click on the search icon in the right corner of the top bar and then enter text to search as shown in the screenshot below:
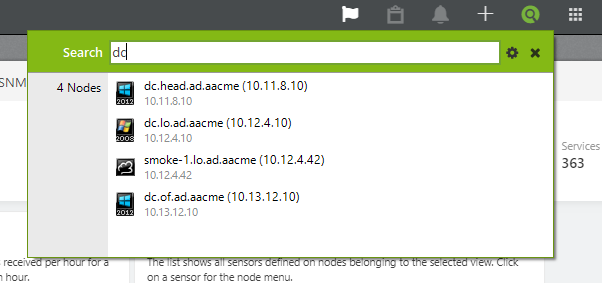
As you can see, I was looking for “DC” and found that there are four nodes that are visible in the search result. It becomes easier to find the nodes and devices in a large environment by using IntelliSearch.
Multiple instances of Report Viewer
NetCrunch ships with its own Report Viewer. The Report Viewer allows you to see reports on various monitoring data collected by the NetCrunch server. To view reports, you need to click on the View menu and then select the Reports action. Once clicked, the Reporter launches the Reporter Viewer utility as shown in the screenshot below:

Tip: NetCrunch supports running multiple Report Viewers on the same computer. If you need to generate a report for another set of computers while the Report Viewer is generating a report, you can always go to View > Reports to run another instance of the Report Viewer. That’s a cool feature as it allows concurrent reporting!
Disaster recovery
To recover from disasters, NetCrunch v10.6 allows you to perform a full backup containing all server configurations including registry settings. You can restore configuration with a few clicks using the NetCrunch console. To take a full backup, click on Atlas > Maintenance > and then select Backup. Once you click on the Backup option, NetCrunch provides you with Quick Backup, Full Backup, and Backup to separate folder:

NetCrunch also allows you to configure schedules for the automatic backup of the NetCrunch configuration. To configure automatic backup schedules, click on the Modify Atlas backup schedule hyperlink as shown in the screenshot above.
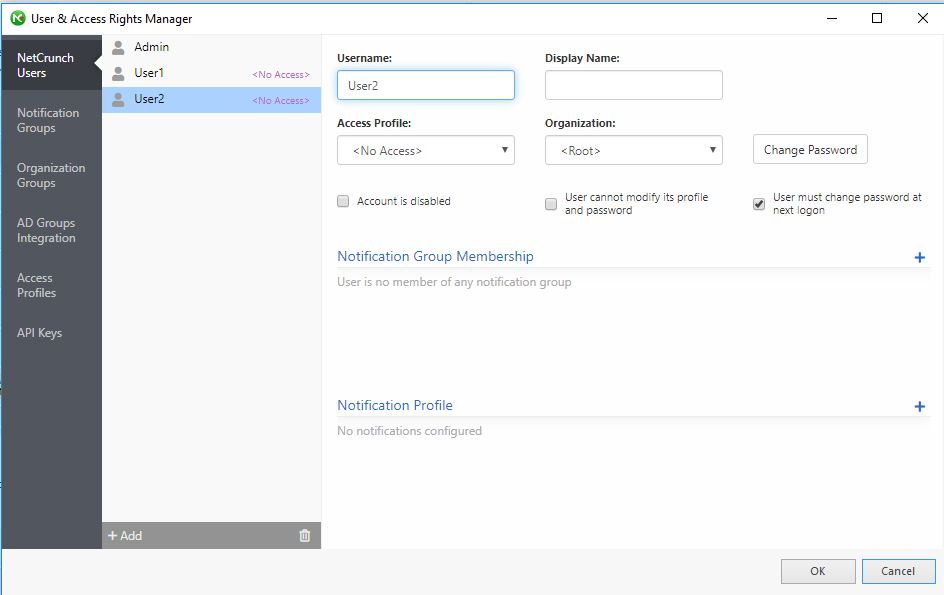
User and access rights manager
NetCrunch provides the flexibility of adding users and creating different access profiles. The profiles contain the rights associated with a specific node or map. These profiles can be assigned to the users/groups you create using the NetCrunch administrator console. Although NetCrunch ships with default profiles, you can always create your own profile by clicking the Access Profiles button found on Users & Access Rights Manager as shown below.
Tip: NetCrunch supports adding user accounts from Active Directory for authentication purposes.
Documentation and knowledge base
I was very happy with the online documentation that made it very easy to configure and set up the product. I followed the online guide available here. You can also find several knowledge base articles here.
Support and pricing
What I have heard from different sources is that the response time for NetCrunch support is fantastic and all technicians are knowledgeable. NetCrunch is a very cost-effective solution. As to the prices, there are several purchasing options available. You can take a look at the different purchasing options here.
The verdict
NetCrunch v10.6 is a great monitoring solution providing all the monitoring mechanisms you need at a reasonable price and without the necessity of installing a monitoring agent on the target devices. I liked the product, as it was very easy for me to set up and more than easy to identify the issues. I would recommend this product for monitoring an organization’s network and I’ve given it a Gold Award with a rating of 4.7 out of 5.
Rating 4.7/5