Linux containers have taken over the enterprise, and we hear so much about Docker and Kubernetes that we forget the equally important tasks of monitoring and logging. Docker continues to grow, and with it comes the growth of the ecosystem of services built around it. Now, though deploying containers predominantly involves running a single app or service inside each container, as the deployments get larger it becomes more and more important to get visibility into the status and health of the environment, not just at the OS or application level, but at the container level as well.
The landscape of monitoring and logging tools is divided into real-time databases, metric gatherers, visualizers, pollers, loggers, and more. There’s been an explosion of open-source products and commercial monitoring applications over the past few years and here’s a look at 10 of the most popular ones.
Prometheus
Prometheus is a leading open-source cloud monitoring solution that deals with time series monitoring, among other things. It’s also one of the nine projects backed by the CNCF, and the second project after Kubernetes to be hosted by the CNCF. This makes it a top choice for monitoring your cloud applications, purely because of the multivendor backing that includes the likes of Google, CoreOS, RedHat, IBM, and others. Prometheus was originally developed by music hosting site SoundCloud, and has since become an integral art of the Docker ecosystem. Prometheus is also actively being used by the CoreOS team to improve the performance of Kubernetes.
Prometheus has developed into an advanced system alerting and monitoring toolkit that’s capable of monitoring a broad range of resources including containers, Hadoop clusters, language runtimes, and application stacks like Python or Go. A lot of people compare it to Graphite (see below), although it adds a lot of functionality including alerting. In short, Prometheus is an open-source monitoring system, time-series database, and a framework for implementing your code. Prometheus doesn’t generate metrics, however, and you have to make the metrics available to it over http in a language it will understand.
Graphite
Graphite is a popular open-source tool used to build web-based dashboards for monitoring and analysis. Though it’s been around for a while and was originally built and designed by Chris Davis at Orbitz over a decade ago to monitor and graph the performance of computer systems, it’s still used in production by numerous large companies like GitHub, Salesforce, and Reddit. Though Graphite does not collect metrics or come bundled with a metrics gatherer, it’s not hard to find a common metric gatherer to feed your metrics into Graphite. Graphite is made up of three parts: Carbon, which is a daemon that listens for time-series data, a simple database called Whisper (similar to RRDtool), and a webapp called Graphite-web that renders graphics on demand. Graphite is still quite popular in the enterprise, and one of the reasons could be a level of automation where all new data points are automatically created in the database.
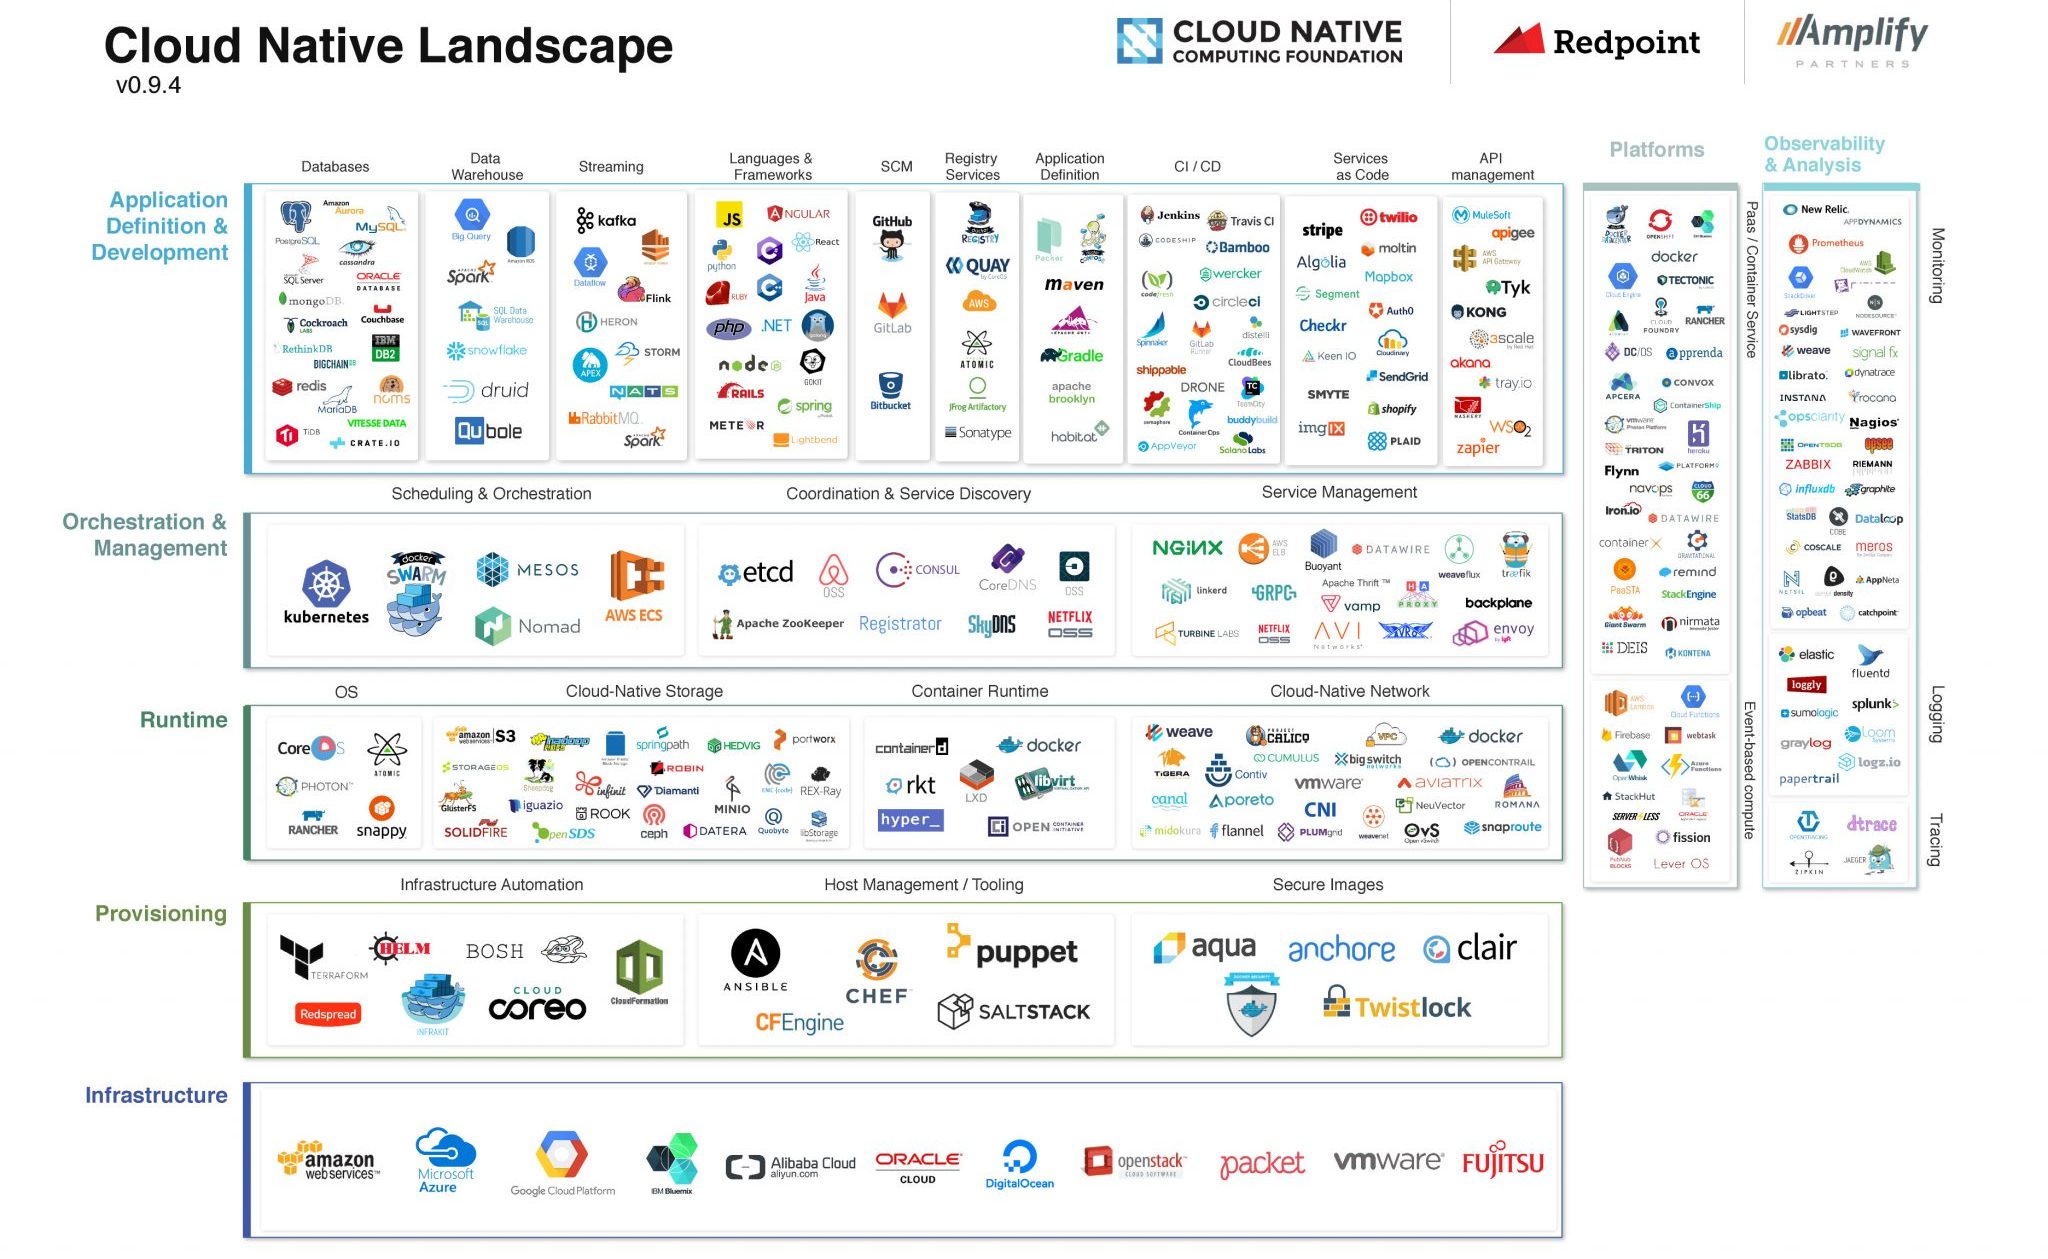
The modern landscape of enterprise tools can be especially confusing since there are ecosystems being developed around ecosystems. What makes matters more complicated is tools like Graphite, essentially three separate tools that are coupled together that can also be used separately and integrated with other tools. Here’s an image of the cloud-native landscape today, where you see monitoring and analysis in the boxes on the right.
Riemann
You may use the Graphite webapp to draw images, but what if you want to use another daemon instead of Carbon? This brings us to Riemann. Though Carbon listens for metrics and writes them to your storage database, it does run into some troubles at scale and a lot of users like to replace it with Riemann. Riemann, however, isn’t a metric collector, but rather a stream processor. Riemann is used to aggregate and process event streams while adding some alerting capabilities to the process as well. Being a stream-processing system, it can be used to feed events to your Prometheus database. It’s especially popular among Clojure developers, as the config file is actually a bit of executed Clojure code that can be highly customized and built on. Riemann works by collecting data from event streams like metrics, logs, events, hosts, and services and then stores, graphs, or alerts as required.
Elasticsearch
Elasticsearch is part of the ELK Stack that also features Kibana, Beats, and Logstash. Though the ELK stack was designed to be an integrated solution, Elasticsearch is often used as a support tool and is a powerful addition to your stack. Elasticsearch is a search engine accessible through an extensive and elaborate API that powers extremely fast searches to support your data discovery applications. It’s compatible with almost everything and is extensively used alongside other tools to query databases.
Kibana
Kibana is an analytics and visualization platform that builds on Elasticsearch and lets you visually navigate the elastic stack. Since Kibana is just the visualization part of the stack it often gets swapped out for Grafana, Graphite, or other visualization tools.
Logstash
Logstash is another stream-processing system along the lines of Riemann and can ingest streaming data from logs, metrics, web applications, data stores, and various AWS services. Logstash also has an output plugin through which you can send specific events to Riemann such as events that are alertable or events that require action by Riemann. Again, Riemann is a very popular standalone tool that is often used with other tools.
Learning how they all work together is like watching a really complicated soap opera. A lot of these tools look like straightforward replacements for each other on the surface, but if you dig deep down they’re all cross-compatible and can be used together for even more specific purposes.
Grafana
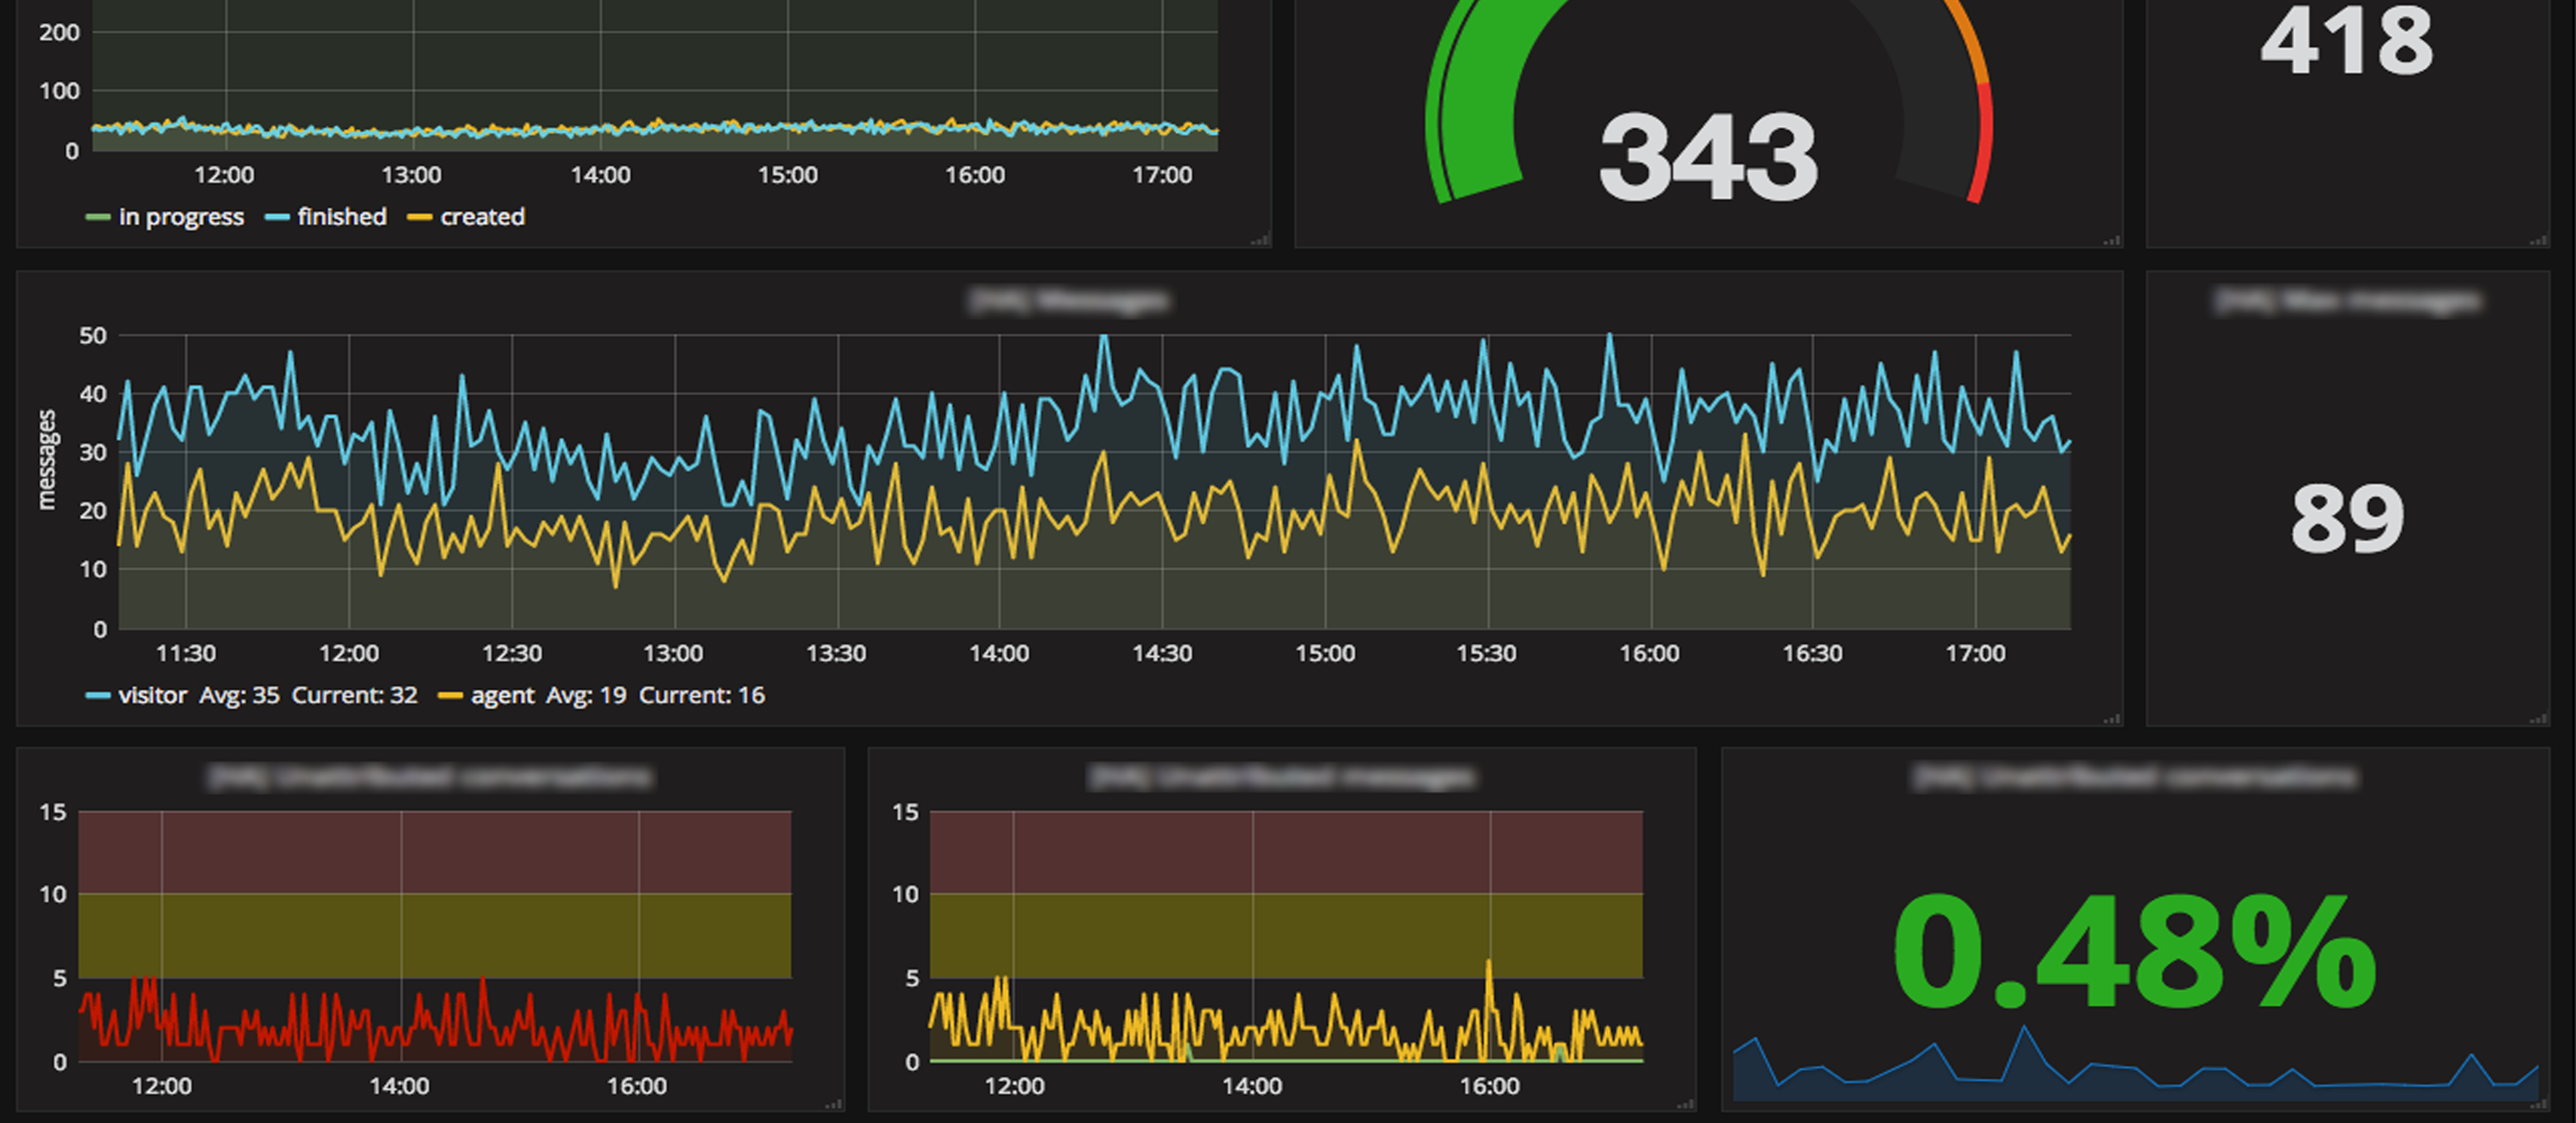
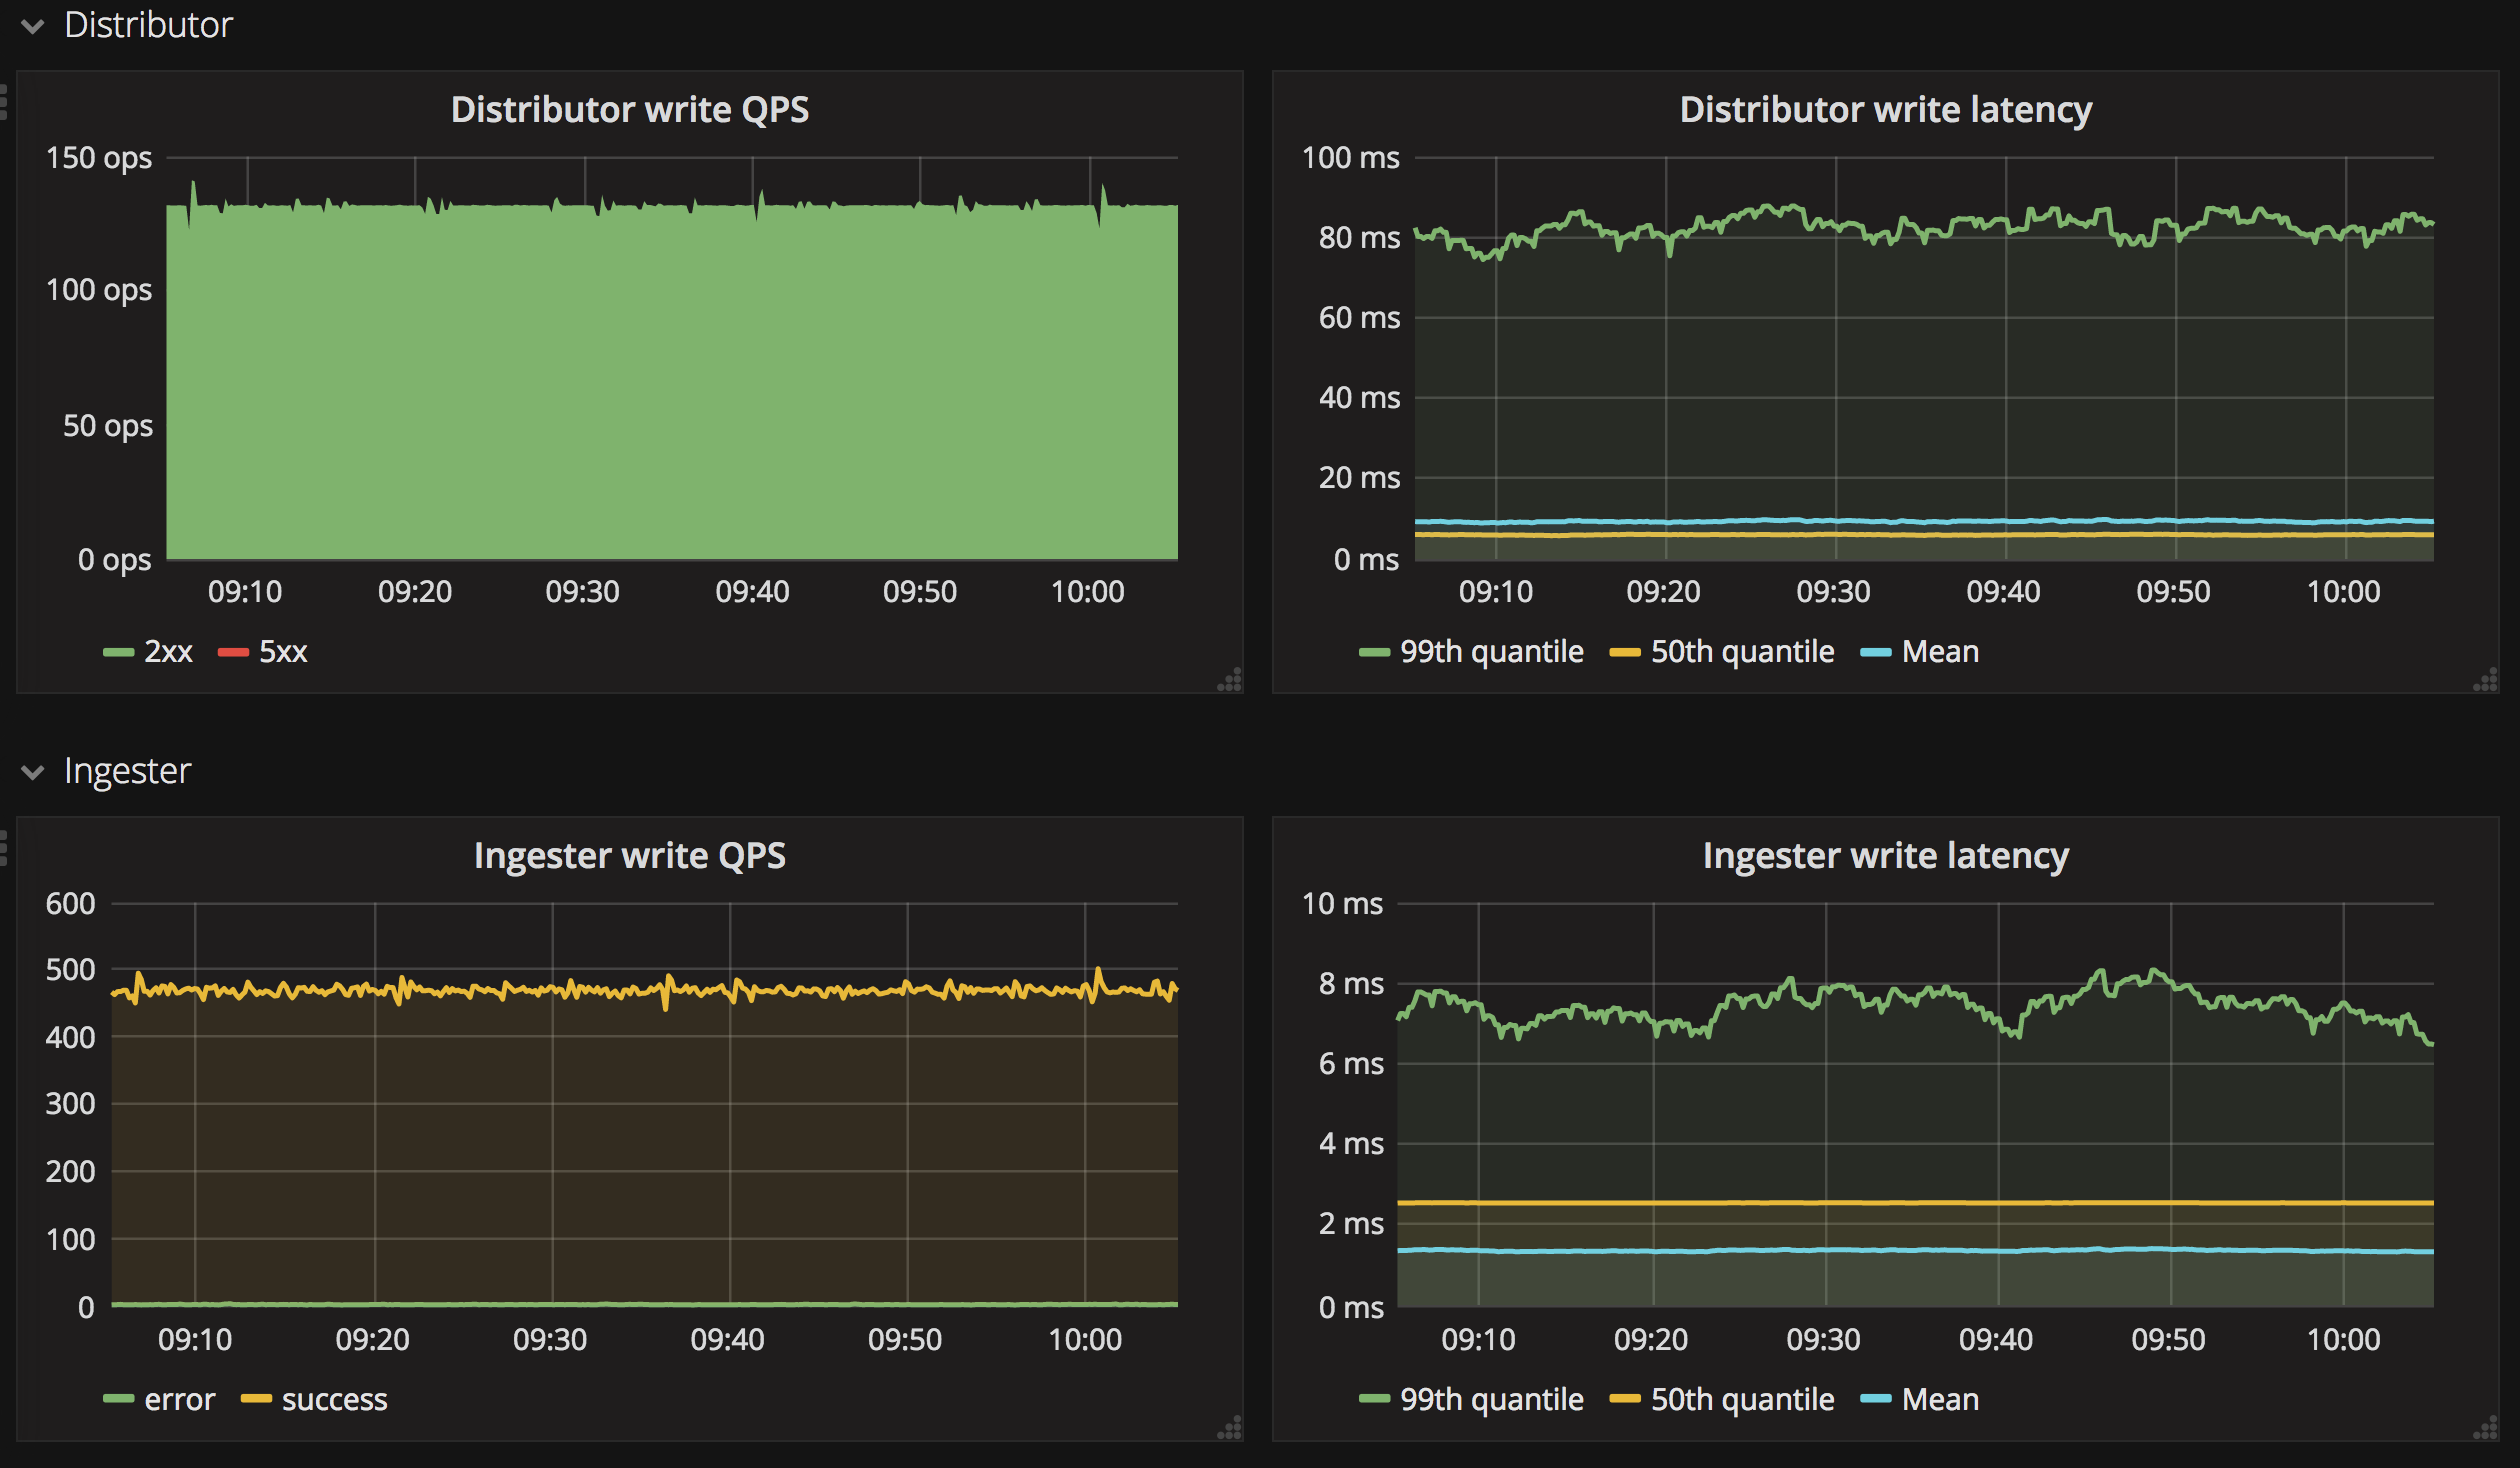
Grafana is an open-source, feature-rich metrics dashboard and graph editor for Graphite, ElasticSearch, OpenTSDB, Prometheus, and InfluxDB. Grafana allows users to easily create and edit dashboards. Grafana allows you to query, visualize, alert on, and understand your metrics, no matter where they are stored. It is especially popular for enabling high-quality, interactive visualizations and graphics.

Kafka
Kafka is another interesting stream-processing system where a stream is an unbounded, continuously updating dataset. Though it was originally developed by LinkedIn to be a scalable pub-sub messaging system, it has since grown into a real-time data pipeline, a distributed and replicated log analyzer, and a unified data integration stack. Kafka is usually installed on each host that needs to produce or forward data somewhere else, and the collection of these hosts form a Kafka cluster.
FluentD
Here we have another project hosted by the CNCF. FluentD is an open-source logging solution aimed at unifying data collection and consumption. The quick-start menu claims to instantly enable users to have a “log-everything” architecture with over 125 system types. The claim obviously comes backed by the CNCF, and FluentD’s largest users currently collect logs from over 50,000 servers. Its popularity is mainly due to it being written primarily in C, and the fact that it treats logs like JSON, which is a popular machine-readable format.
Weave Scope
Last but by no means least on our list, we have Weave Scope. Weave Scope covers monitoring, visualization, management, and troubleshooting. It also automatically creates a map of your application without any coding or setup required. This allows you to monitor and control your stack on a container level and actually find out exactly what your containers are doing and why. With zero configuration and automatic detection of all processes, containers, and hosts, this tool checks the speed box and is a definite time saver for any developer.
As more and more tools develop for more specific workflows, no tool has a permanent spot in the stack, and any of them could be swapped out for something better, more efficient, or more customized at any given time. But as it stands today, these open-source monitoring tools occupy an essential spot in every DevOps team’s monitoring arsenal.
Photo credit: Grafana


have you checked Zabbix ? what would you say ?
I have been working on an open source tool as well. You can check it out on GitHub https://github.com/randy-girard/app_perf or my blog https://www.randygirard.com/category/appperf/
I recently came across a full-stack open source observability tool called SigNoz: https://github.com/SigNoz/signoz
Both metrics and traces, can be self-hosted.