We covered the entire Service Map deployment including the client portion in a previous article here at TechGenix. Now it is time to explore the functionalities available in this useful service.
We can start by opening the Service Map and there are a couple of ways to achieve this task: My favorite is opening the OMS Workspace that is hosting the service. Click on Solutions and then ServiceMap(LogAnlytics-Name) entry. In the new blade, click on the Service Map box located at the Summary section. Another option is opening the OMS portal, and the same Service Map box will be listed there — click on it.
The interface is powerful but at the same time simple, with most of the features just one click away. This facilitates the process to troubleshoot and helps us understand what is going on. In the past, doing a similar process would require several tools such as SysInternal Tools and Wireshark.
Let’s start with a long view of the interface: When troubleshooting, we must understand the time range of the information being displayed and we can define that on item 1 in the image below. In item 2 and item 3, we can see all the servers reporting to the service, and we can group them in Groups. Groups are key to group together servers sharing the same workload and that helps to see the flow from a macro perspective. For example, creating groups for different tiers such as frontend, backend, databases, etc.
Note: All Service Map data is stored in Log Analytics for seven days in free workspaces, and 30 days for all other paid options.
Item 4 is key for troubleshooting. Using the first two buttons, collapse and expand allow us to show more information, and we can click more than once to get more information. In the filter, we can decide to see objects that do not have the agent installed (Show non-agents backends). My recommendation is to always leave the filter enabled to see the entire picture.
In item 5 we have a toolbox of additional information, and the badges will be displayed based on the context of the selected object. We will explore some of those options in the next section. It integrates with other solutions from OMS workspaces, such as Azure Alerts, Change Tracking, Updates, Log Events, and Performance.

The easy way to get a good idea how to use Service Map is selecting the desired computer that is listed on the Machines tab. Keep in mind that only computers that have the installed agents (it is plural because we need the Microsoft Monitoring Agent and the Dependency Agent installed on the VM) will be listed.
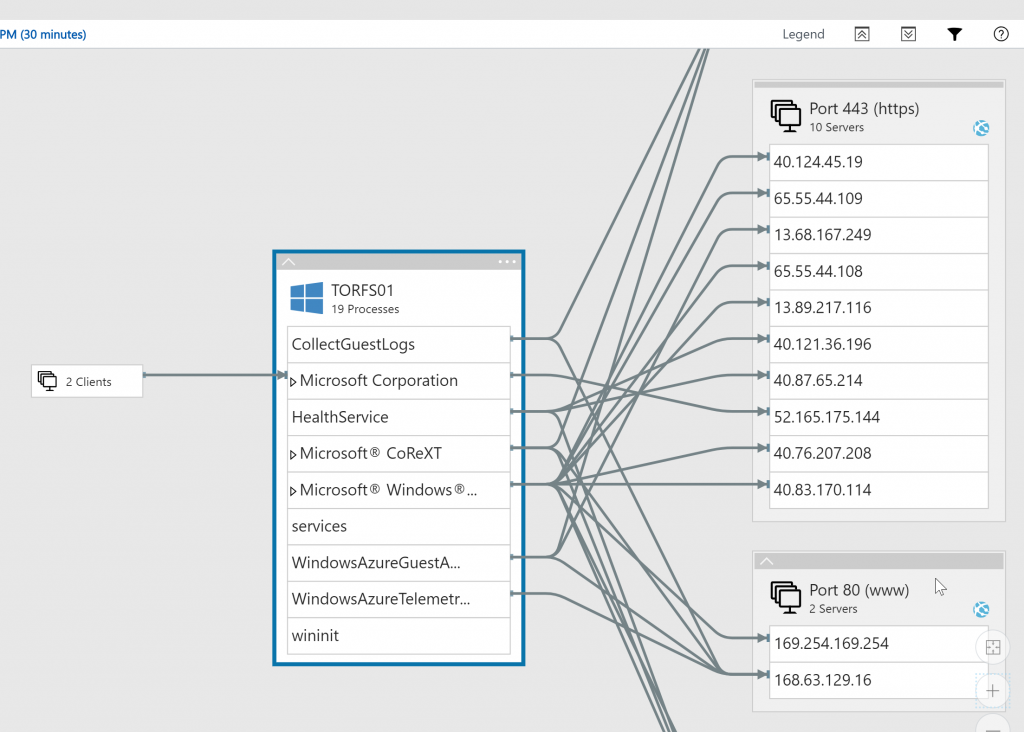
Let’s start by clicking on the server TORFS01, and to make things more interesting, let’s expand (second icon on the right in the Legend area). The result will be all connections from that VM to other objects, but also the process that initiated that connection. It is important to notice that Port 443 (https) is a Server Group automatically created by the solution, and within that group, we have all IPs that server connected using that port. Is it great or what?
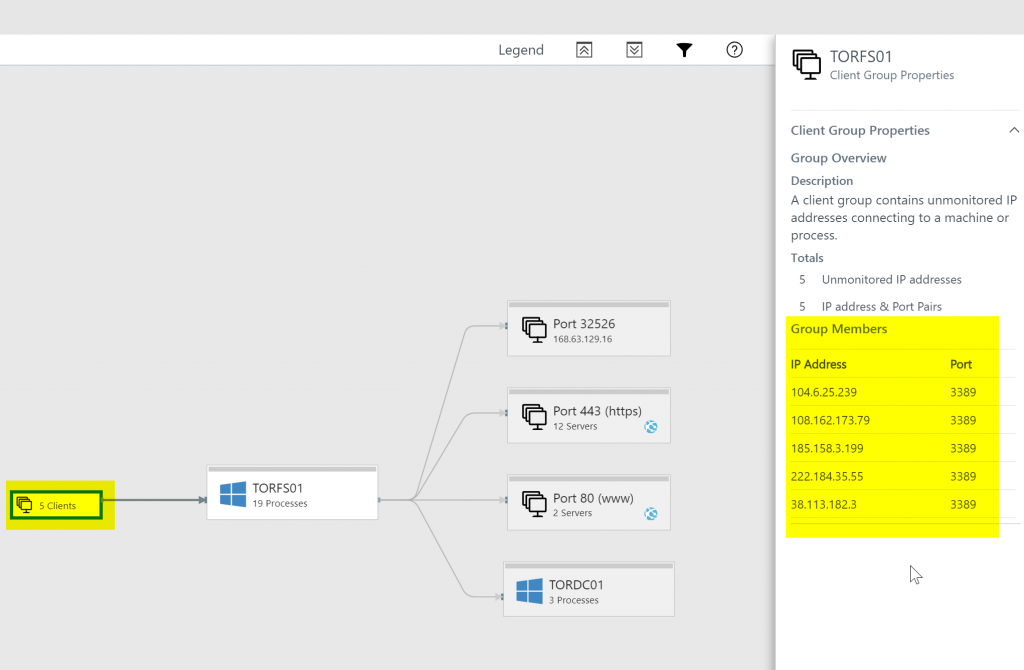
Another useful option is checking who is connecting to your VM. We can easily check that by clicking on the Clients that we have connections to (the arrow points from the object/group to your selected server) and we can see them in the properties. It will list all public IPs and the port that they were using. In less than one hour we had five public IPs trying to connect to our VM while writing this article. That is one of the reasons to avoid exposing your VMs with public IP if they are not required to.
A common scenario during security investigations/incidents is to find out what any given service is doing. We just need to select one of the processes. In our example WindowsAzureTelemetry process, we will see a bold line and we can see in a glance all the IPs that were used for the connections, and at the same time we have the Summary being expanded automatically and we have a summary of how many connections and details of the service. If we want to be more specific, we can click on Properties and we can see even the name of the executable file that is responsible for the service!

Getting the server performance badge in Service Map
By default, the agent does not retrieve performance from the servers, thus we can’t see any performance in Service Map. In order to enable this option, check the Advanced Settings of your Workspace. In the new page, click on Data, select Windows Performance Counters, and click on Add the selected performance counters, add or remove the performance counters available and click on Save.

That will refresh the agent to start collecting those metrics and they will be available after a while in the Service Map. Wait a few minutes, click on a Windows Server, and check the Performance option. The result will be a graph of the data on that blade.
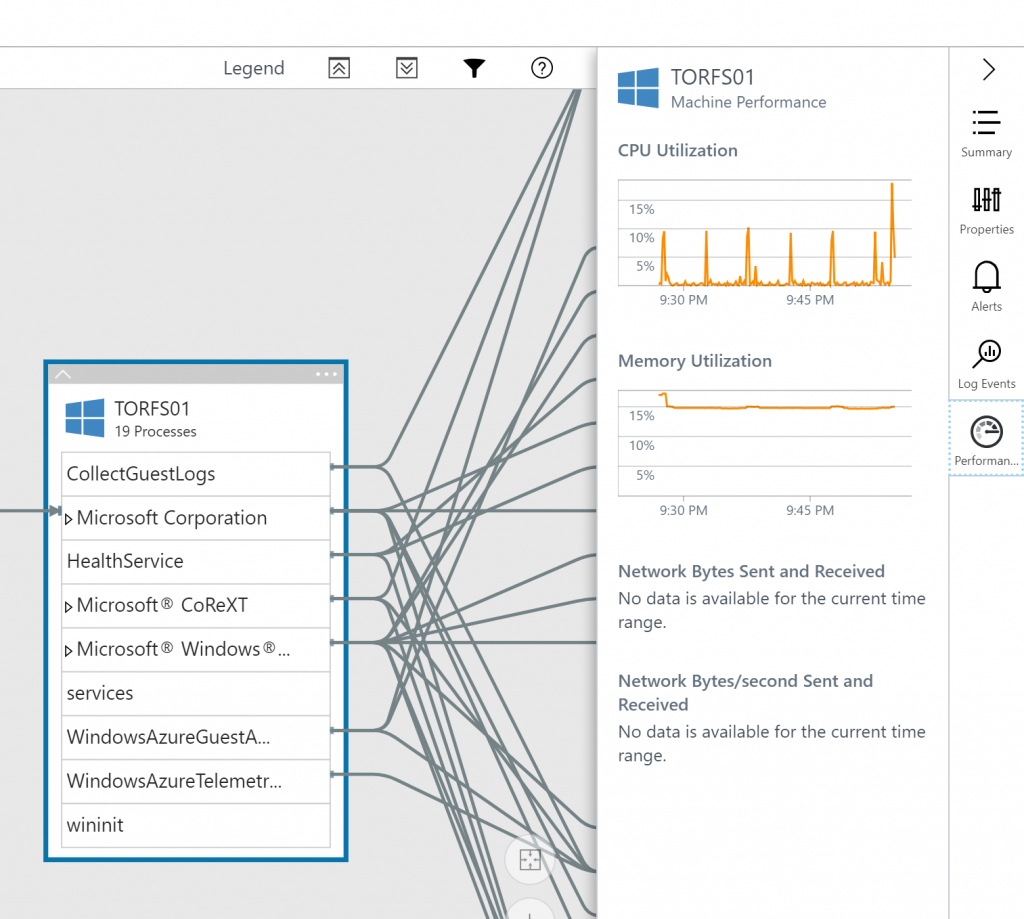
Pretty neat, right?
Featured image: Shutterstock