Product: SolarWinds Application Performance Monitor
Product Homepage: click here
Free Trial: click here

Over time, applications inevitably become more complex. Today’s server applications commonly consist of multiple tiers and may leverage several different databases. Furthermore, these various application components might not all be in the same place. It is becoming increasingly common for some of an application’s elements to reside on premises, while other parts of the application exist in the public cloud. Unfortunately, inherent complexity makes it far more difficult to troubleshoot applications when problems occur.
In an effort to help organizations to keep their applications running smoothly, SolarWinds has created a product called Application Performance Monitor. Application Performance Monitor is designed to monitor custom .NET applications that are running on Microsoft IIS servers. If such an application were to experience performance issues, Application Performance Monitor can quickly pinpoint the source of the problem by allowing you to visualize performance bottlenecks, and then determine the underlying root cause of those bottlenecks.
Deployment and integration
Typically when I review a product, I like to give an overview of the deployment process. Over the years, I have found that some products work right out of the box, while others are nearly impossible to configure. In the case of SolarWinds Application Performance Monitor, I was provided with a preconfigured lab environment, so I did not get to deploy the software myself. Even so, I have worked with enough SolarWinds products to be able to tell you that SolarWinds uses a standard installer and that deploying and configuring SolarWinds products is typically an almost effortless process.
Like most other SolarWinds products, Application Performance Monitor integrates with the Orion dashboard. This instantly gives Application Performance Monitor a familiar look and feel. Furthermore, Application Performance Monitor integrates with SolarWinds Server and Application Monitor, which means that you can have a single pane of glass view of your custom and off the shelf Web applications.
Response time heat map
Of the various features found in Application Performance Monitor, my personal favorite is the response time heat map. SolarWinds products have always provided a lot of data visualization tools, but I think that the company did an especially nice job creating this one.
Application Performance Monitor contains a menu called Traced Requests. Within this menu, the tool provides you with the option of looking at traced queries, traced calls, traced cache calls, or traced exceptions. Upon making your selection, you are given the option of narrowing down the results by looking at a certain percentile. If you look at the screenshot below, for example, you can see that I am looking at traced requests below the 95th percentile. This capability is helpful because it allows you to examine query by duration.
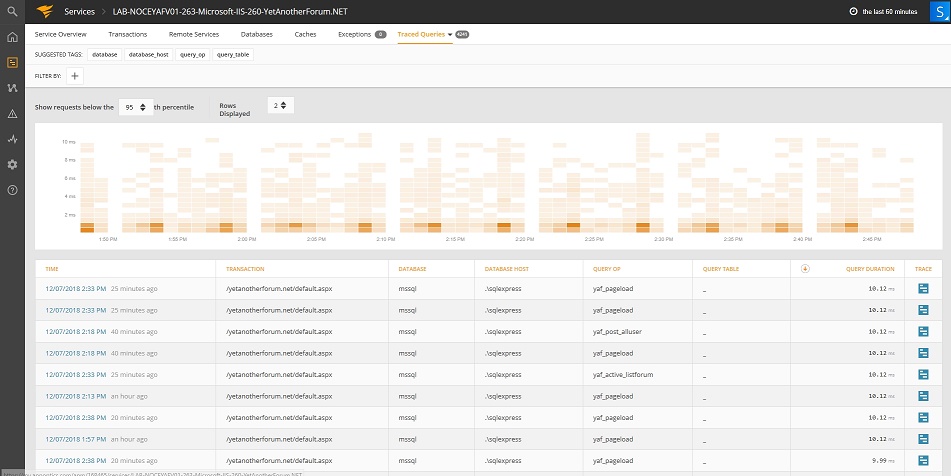
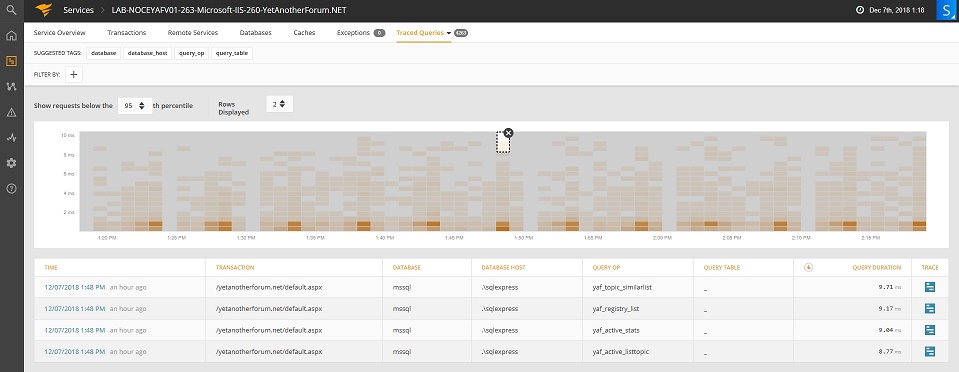
What’s more impressive, however, is the way that Application Performance Monitor allows you to drill down into the query results. If you look at the previous screenshot, you will no doubt notice the chart showing query response time. You can also see that some of the queries take in excess of 10 milliseconds to complete. If I wanted to know more about those particular queries, I could simply draw a box around the portion of the chart that I was interested in to see more detailed information about the items that I selected. If you look at the next screenshot for instance, you can see that I can see the time, transaction, database, host, and more.
One more thing that I want to point out before I move on is that the table showing the individual results in the previous screen capture contains a Trace icon for each returned query. Clicking this icon takes you to a screen that provides an extremely detailed breakdown of the query. As you can see in the following screen capture for instance, Application Performance Monitor displays activities related to both IIS and SQL Server. You can drill down into this chart to view the entire query response in granular detail.

Transaction performance monitoring
SolarWinds Application Performance Monitor also allows you to perform transaction level performance monitoring. This is unique, because most performance monitoring tools that are available today are designed to provide performance metrics at the hardware, operating system, or application level. In contrast, Application Performance Monitor breaks down your application’s performance by query type. That way, you can see which types of queries are completing quickly and which are taking longer to complete.
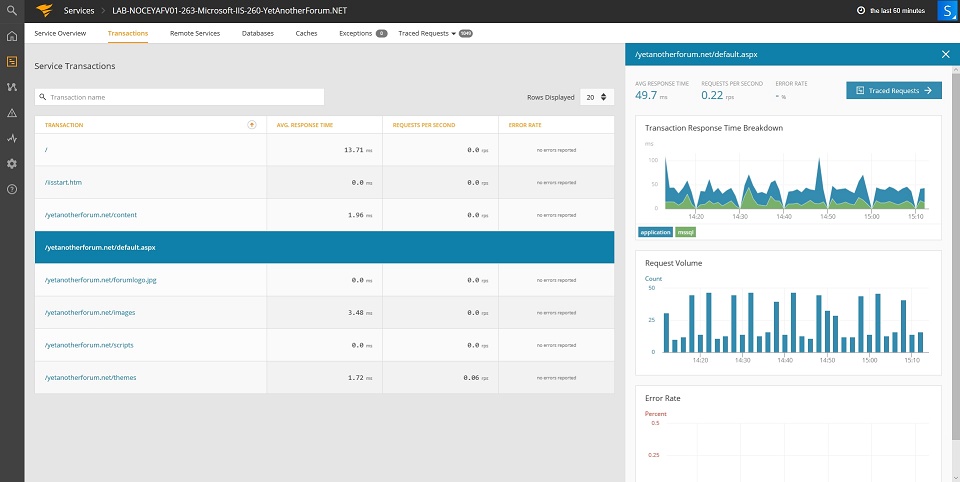
You can see what the transaction performance monitoring interface looks like in the screenshot below. As you look at the screenshot, you can see that performance data is being displayed for transactions related to individual application items including HTML pages, images, and more. For each transaction type that is displayed, the tool shows you the average response time, the number of requests coming in each second, and the error rate.

As helpful as this information may be, you can take things a step further. You might have noticed in the previous screenshot that each listed transaction is hyperlinked. Clicking on a transaction causes the console to display a more granular breakdown of the data. In the next screenshot, for instance, you can see that the chart differentiates between application response time and SQL response time. There is also a button that you can click to examine related traced requests.
I have already shown you what traced requests look like, but I want to emphasize what I said earlier about Application Performance Monitor allows you to drill down into a trace request. This capability can be extremely helpful in resolving application performance issues, because the tool allows you to see exactly which hosts, databases, etc. serviced the query. You can see an example of this in the next screenshot.

Having access to this type of information is especially useful when it comes to troubleshooting performance issues with distributed or multi-tier applications. You might for instance be able to determine that a particular query response is slow, because of the latency involved in accessing a database residing off premises.
The verdict
When I first decided to review this tool, my biggest concern was usability. The idea of being able to visualize performance bottlenecks and then drill down into the root cause of those bottlenecks is certainly appealing, but I wondered how practical the tool would actually be. Over the years I have worked with numerous performance monitoring and application monitoring tools. Many of those tools have been over complicated, and required the administrator to know how to interpret raw metrics. Other tools that I have used (particularly ones related to application monitoring) seem as though they are geared more toward developers than administrators or network architects. Based on these past experiences, I wondered if the SolarWinds tool would be something that the average administrator would be able to use without a significant learning curve.
Admittedly, I had a bit of difficulty with the interface when I first got started. I didn’t have the product documentation at my disposal, and I wasn’t quite sure where I needed to go within the Orion dashboard to get started. Ultimately, I had to reach out to SolarWinds for help.
I was pleasantly surprised by just how quickly SolarWinds responded to the email message that I sent them. Not only that, the guidance that they provided me was exactly what I needed, and I was up and running within minutes. On a side note, there isn’t anything particularly difficult about getting started with Application Performance Monitor. My troubles were my own fault, because I was clicking on the wrong links.
Once I got into Application Performance Monitor, I found the interface to be very nicely done. As you can see in the screen captures that I have included in this review, Application Performance Monitor manages to give you all of the information that you need to track down performance issues on your Web servers, and presents that information in a way that is easy to digest. You don’t have to be an engineer or a developer to understand what the tool is telling you.
As far as the interface itself goes, I found it to be relatively intuitive, but also found that I needed to spend some extra time exploring the interface to familiarize myself with its features and capabilities.
Another big question that I had prior to beginning this review was what would be required in order to link Application Performance Monitor to an application that needs to be monitored. A few years ago, I tried out a different application monitoring tool from another vendor and found that the Web application’s code actually had to be modified before the monitoring tool would be able to do its job. I am happy to say that this is not the case with Application Performance Monitor. Application Performance Monitor makes use of an agent that runs on the IIS server rather than requiring you to write any custom code.
So what was my overall opinion of Application Performance Monitor? Well, whenever I review a product for this site, it has become customary for me to assign the product a star rating, ranging from zero to five stars. After spending a considerable amount of time with SolarWinds Application Performance Monitor, I decided to give it a score of 4.7 stars, which is a gold star score. In my opinion, the interface can be a little bit busy in places, but overall the product does exactly what it is supposed to do, and does it well.
TechGenix.com Rating 4.7/5
Learn more about SolarWinds Application Performance Monitor or download a free 30-day trial.