Product Review: Server Configuration Monitor
Download a free trial: Click here

Server configuration drift can be a huge problem for any organization. Unexpected modifications to a server’s configuration may indicate the presence of malware or perhaps even an attack in progress. Even in completely benign situations though, configuration drift can increase management and support costs, and can adversely affect an organization’s compliance initiatives.
Recently SolarWinds has introduced a brand new product called Server Configuration Monitor that is designed to help organizations to detect changes to a server’s hardware and software configurations. Being that I have reviewed so many other SolarWinds products over the years, I was really curious to take a look.
The Installation Process
Like SolarWinds’ other products, Server Configuration Monitor is integrated into the Orion Platform. If you have experience deploying other SolarWinds products, the installation process, which you can see below, will feel very familiar.
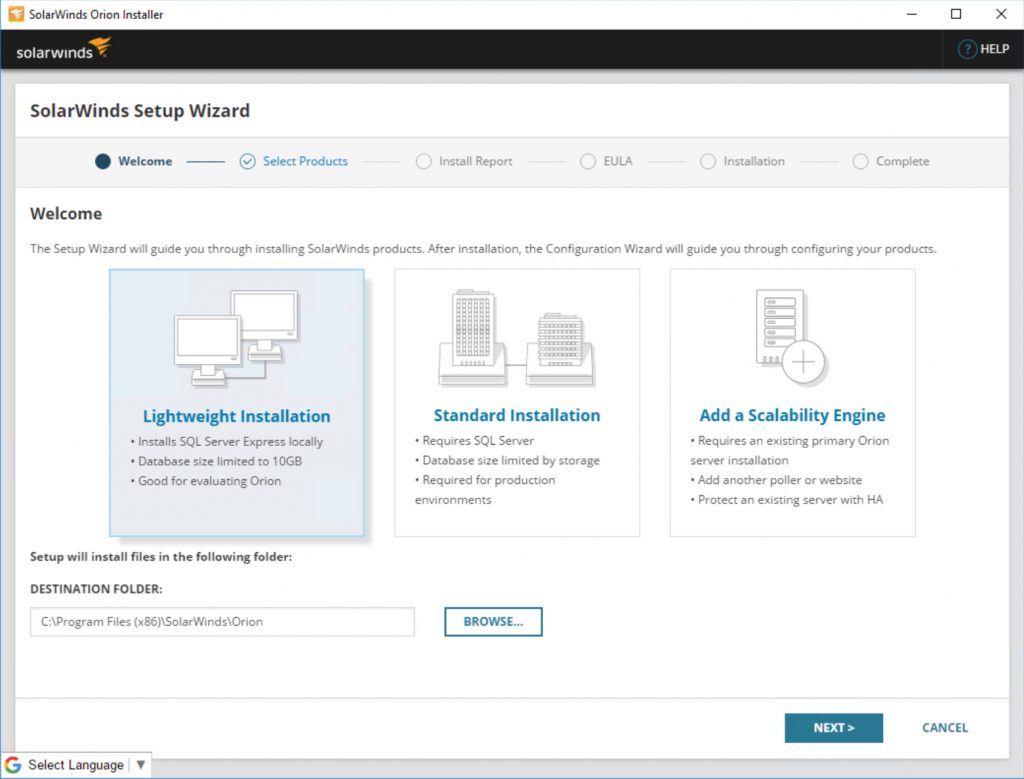
I found the installation process to be completely straightforward. The only issue that I encountered, was that the installation was extremely time consuming and took nearly 12 hours to complete. Given my experience with other SolarWinds products however, I am going to assume that the excessive installation time was probably related to something going on with my hardware (like maybe a background RAID rebuild operation), rather than being caused by a problem with the software.
Working with Server Configuration Monitor
Once the software has been installed, you are taken to a screen like the one shown in the figure below. As you can see, the Discovery Central screen gives you the option of discovering your network, performing a server configuration discovery, or downloading and installing an agent.
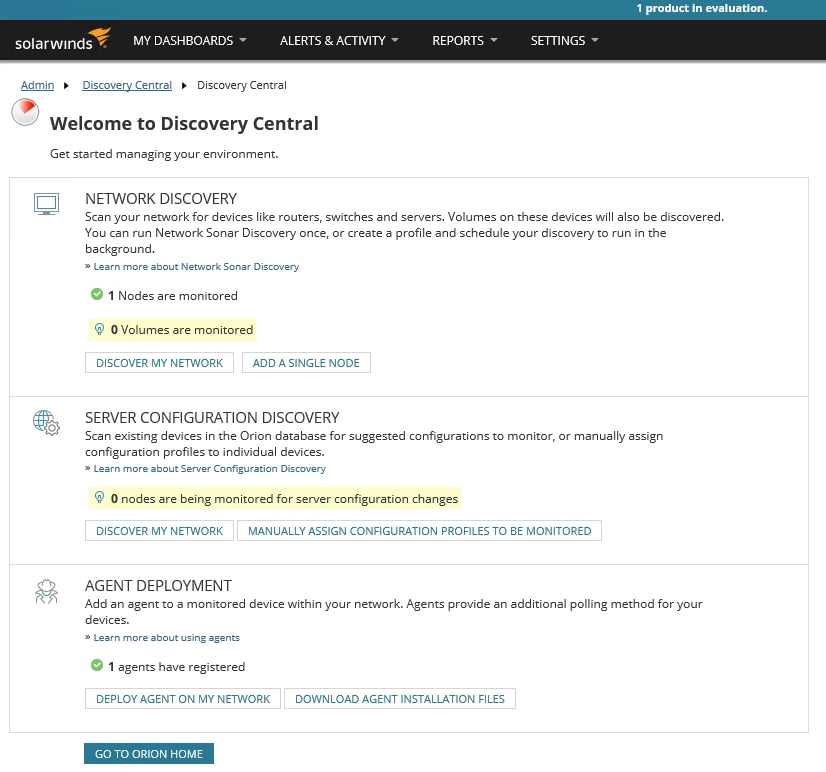
In the interest of seeing how Server Configuration Monitor works, I set up a brand new Windows Server 2016 virtual machine, running a default configuration, and then deployed the SolarWinds agent to that VM. Deploying the agent and then working through the Server Configuration Discovery proved to be a simple process that I was able to complete in a matter of minutes.
With everything now up and running, and a couple of systems being monitored, I went to the Server Configuration Summary dashboard to take a look around. You can see what the dashboard looks like in the figure below.

The first thing that I did on this screen was to click on the system that I had set up earlier because I wanted to check out its configuration details. As I did, I noticed that just hovering my mouse over the system provided a nice configuration summary, while clicking on the system took me to the Configuration Details page. As you can see in the next figure, this page displays the hardware inventory, the software inventory, and the configuration details for IIS.
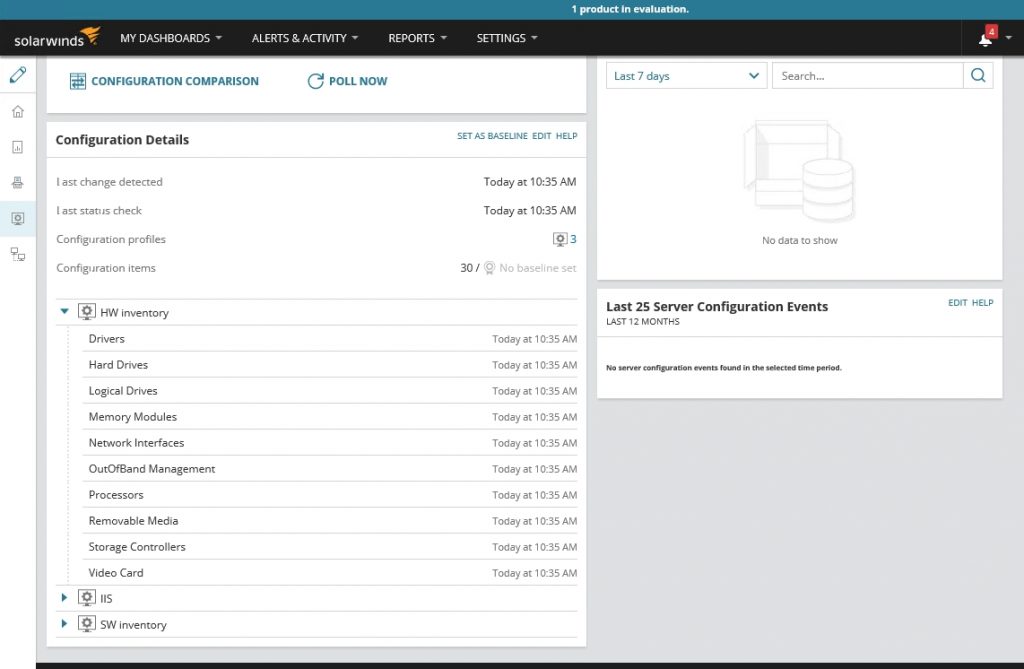
The screen capture above does not actually show the inventory details, but clicking on an item causes the console to display detailed information about the item. The screen capture below for example, shows what happened when I clicked on the Hard Drives container.

One thing that struck me about the hardware inventory is that the software is not just designed to display a server’s hardware inventory, but also to detect changes to the hardware inventory. In the case of a physical machine, the software might be used to confirm a hardware upgrade, detect a disk failure, or detect component theft (which I have actually seen happen in the real world). What I find more interesting though, is that in the case of a virtual machine, the software could presumably detect dynamic spikes in resource allocation (such as the system automatically allocating extra memory to a VM), thereby alerting administrators to conditions that might previously have gone undetected.
The next thing that I did was to return to the Node Details screen and set the server’s current configuration as a baseline by clicking on the Set as Baseline link. This caused a really nice, green icon to be displayed in the console indicating that the server is running its baseline configuration. I really liked this icon, because it means that I never have to wonder if anything has changed or not. The icon makes it obvious. The icon is shown in green if no changes have occurred but is displayed in red if changes have been detected.
Once I had established a baseline, I went to the system that I had just baselined and ran Windows Update. As luck would have it, there were a few updates available so I installed all of the updates.
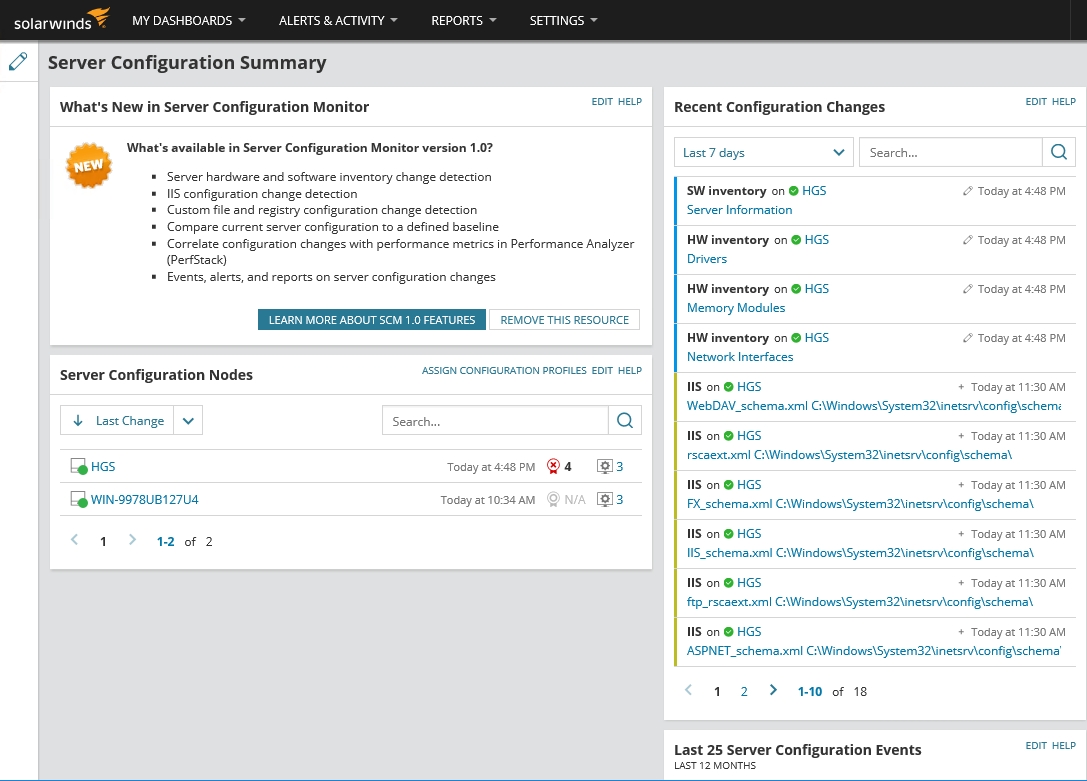
Once the server was updated, I went back to the Orion console and noticed that the console’s home screen displayed recent configuration changes, as shown in the figure below.
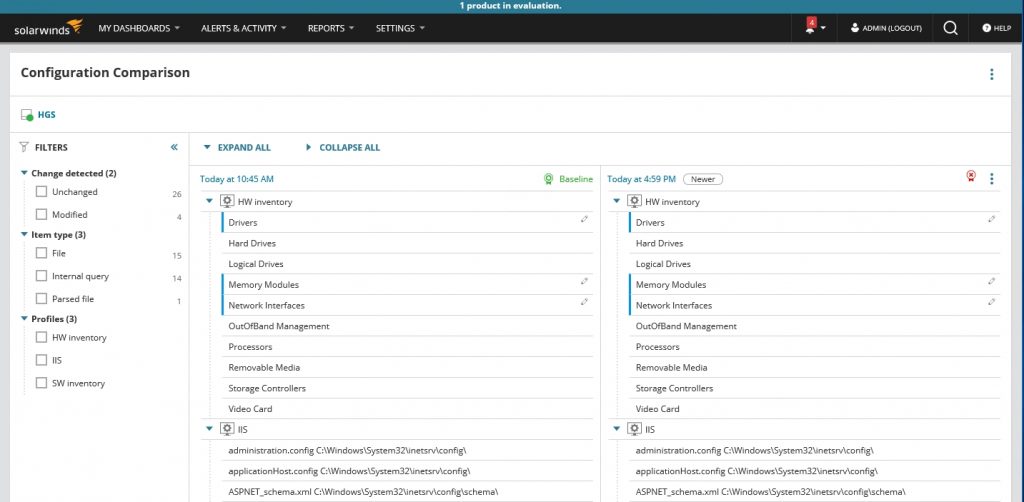
Next, I went into the screen for the server and clicked the Configuration Comparison button. This screen allows you to do an item by item comparison between the baseline configuration and the current configuration. As you can see in the figure below, this screen shows you a variety of item types.
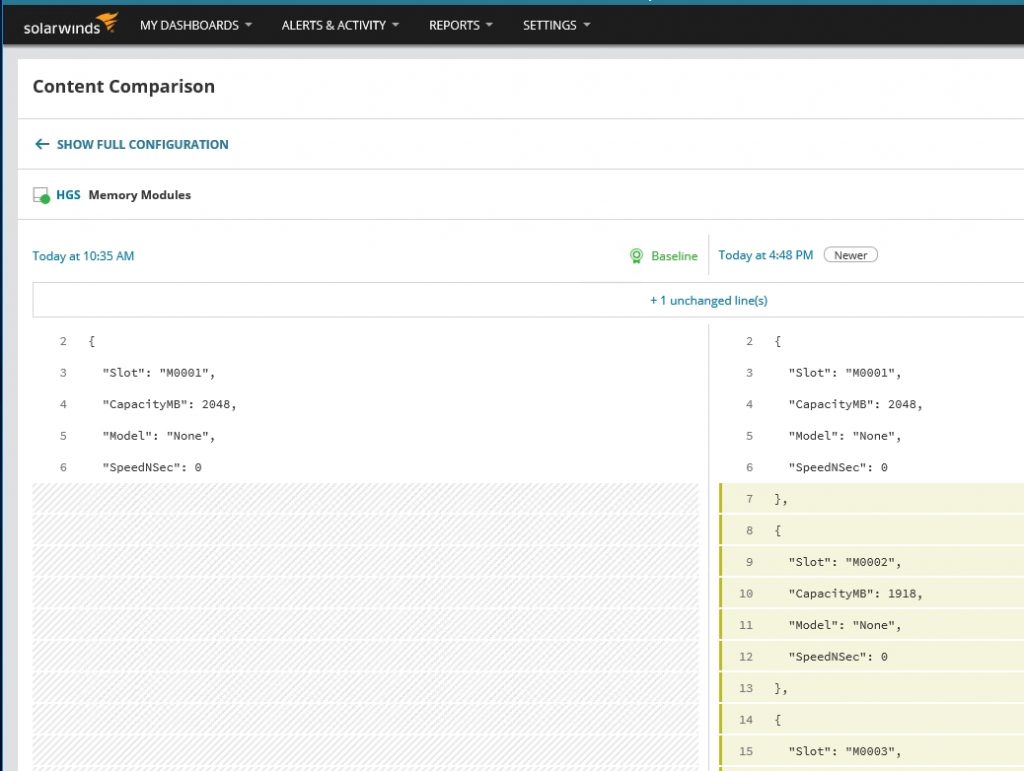
As previously noted, Server Configuration Monitor is able to monitor hardware changes, not just software changes. As a part of my testing efforts, I allocated some additional memory to the server that I was monitoring. Server Configuration Monitor picked up on the change, as shown below.
Without a doubt, Server Configuration Monitor’s most compelling feature is its ability to cross-reference system changes with performance data. For example, I could have cross-referenced the addition of memory that I mentioned above, with various performance metrics in an effort to gauge the effectiveness of the change.
Similarly, If an administrator notices an unexpected drop in performance, it is actually possible to see if any changes were made that might have caused that performance drop. If you look at the next figure, for instance, you can see that I have cross-referenced the average CPU load for my test system with the configuration changes that were made to that system. You can see a configuration change just before 5:00 PM that resulted in a huge CPU spike.

The Verdict
When I write a review for this website, it has become customary for me to assign the product a star rating ranging from zero to five stars (with five stars being the best possible score). Assigning a rating is normally a simple process, but I admittedly had a tough time coming up with an appropriate score for this one.
On one hand, this product worked exactly as advertised. The software seemed to be stable, and I didn’t run into any bugs during the review process.
On the other hand, Server Configuration Monitor is currently a 1.0 release. It still feels somewhat unfinished and lacks some of the features that I really expected to see. For example, the software does not support configuration monitoring for Linux servers, nor is there a remediation feature that can reverse detected changes. My guess is that SolarWinds will probably add lots of features in the future, but for right now the software is somewhat lacking in its capabilities (although I do have to give the company kudos for the software’s use of PerfStack).
After a lot of deliberation, I decided to give Server Configuration Manager a score of 4.4 stars, which is a silver award. I based my decision on TechGenix’ Product Review Rating Guidelines which lists the criteria for receiving such an award as “the product performs very well and is very good in its class. There are no major issues…”
Learn more about SolarWinds Server Configuration Manager or download a free trial.


Hi Brien,
Thanks for providing such an honest and thorough review!
Have you tried Navicat Monitor for MySQL/MariaDB? Although Navicat has been around for a while, they only released their monitoring product a little over a year ago now. I have been using it since that time and have been quite impressed by it.
I can’t believe that the installation of Solarwinds took nearly 12 hours to complete! Navicat Monitor employs an agentless architecture so you don’t have to install any software on the database servers being monitored. You only need to install software on the device that you’ll be using to connect to Navicat Monitor. It may be viewed by any modern web browser.
Best regards!
Rob Gravelle