When it comes to troubleshooting performance issues in a Hyper-V environment, it is sometimes tempting to skip steps related to the processor. After all, performance problems commonly stem from more limited resources, such as storage IOPS, memory, or network bandwidth. This is exactly why it is important to make sure that the system’s CPU is not the source of processor bottlenecks. Modern CPUs are so capable that they are sometimes overlooked when troubleshooting performance problems.
Troubleshooting processor bottlenecks: Start with host Performance Counters
When it comes to native Windows tools, the Performance Monitor is the tool of choice for troubleshooting performance problems. If you suspect that performance problems might be related processor bottlenecks caused by a lack of CPU resources, there are three Performance Monitor counters that you should watch on the Hyper-V host:
• Logical Processor Utilization \ Hyper-V Hypervisor Logical Processor(*)\ percent Total Run Time
• Virtual Processor Utilization \ Hyper-V Hypervisor Virtual Processor(*)\ percent Total Run Time
• Root Virtual Processor Utilization \ Hyper-V Hypervisor Root Virtual Processor(*)\ percent Total Run Time
Each of these three counters looks at the percentage of time that the associated processor object is in use. To make sure that you truly understand what it is that these counters are showing you however, I want to take a second and review some Microsoft terminology.
Key terminology
The three Performance Monitor counters listed above deal with logical processors, virtual processors, and root virtual processors. In Microsoft-speak, a logical processor is “a processing unit that handles one thread of execution.” Keep in mind that although a logical processor could be a CPU core, the number of logical processors within a system can sometimes exceed the number of CPU cores because of technologies that allow a core to handle multiple threads of execution.
Virtual processors are a type of virtual hardware. When we create a Hyper-V virtual machine, that virtual machine is provisioned with various virtual hardware components. For example, a virtual machine usually receives a virtual hard disk. As I’m sure you know, a virtual hard disk is not the same thing as a physical hard disk. A physical hard disk is a tangible, physical hardware component that is capable of storing data. A virtual hard disk is really nothing more than a file that is designed to emulate physical storage. As such, the virtual hard disk resides on physical storage and consumes some of the available physical disk space, but does not commonly consume all of the underlying physical storage. Virtual processors work somewhat similarly. A virtual processor is not a physical processor but rather a virtualized representation of a physical processor. A virtual processor utilizes a physical processor behind the scenes, but a single physical processor usually accommodates multiple virtual processors.
Finally, a root virtual processor is a virtual processor used by the Hyper-V host. The root virtual processor does not service virtual machine workloads.
What to look for
So now that I have explained the differences between logical, virtual, and root virtual processors, let’s take a look at the corresponding performance counters. As previously noted, you would want to watch these counters on the Hyper-V host, not from within a virtual machine.
The method that you will use to add the performance counters to the Performance Monitor varies slightly depending on the version of Windows that you are using, but you can see an example of adding a counter in the figure below. You will notice that the listing of counters that appeared earlier in this article included an asterisk. This asterisks indicate that you should monitor all instances of the selected object.

The first thing that you will want to examine is the Hyper-V Hypervisor Logical Processor (_Total)\ percentTotal Runtime counter, which you can see in the figure below. The Instance column indicates that this is the _Total (or aggregate) value.

The Hyper-V Hypervisor Logical Processor (_Total) \ percentTotal Run Time counter should be less than 90 percent, and this value should remain below 90 percent (although isolated spikes above 90 percent may be OK). Higher values indicate that the system has inadequate CPU resources, and either needs a CPU upgrade or needs to run fewer VMs. This could certainly be an indication of performance issues cause by processor bottlenecks.
Next, take a look at the Hyper-V Hypervisor Virtual Processor \ percentTotal Runtime counter. If you look at the Instance column within the figure below, you can see that there is an instance of this counter for each running VM. As such, the counter examines the virtual processor workload on a per VM basis.
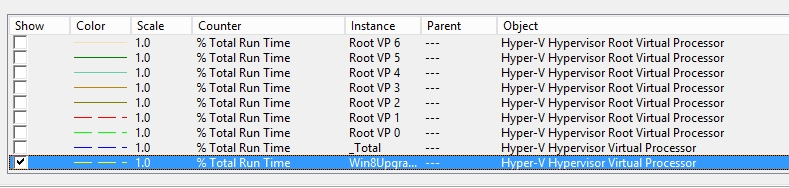
Ideally, each instance of this counter should be at less than 90 percent. If the counter is above 90 percent, then you will need to check to see if it is only some VMs that have elevated values, or if all of your VMs are consuming more than 90 percent of the virtual CPU time.
If only some of the VMs are showing values over 90 percent, it indicates that specific VMs are short on CPU resources. You may be able to resolve the problem by adding extra virtual CPUs to the VM, but often times an elevated CPU workload is a sign of another problem. For example, a lack of memory can lead to excessive paging, which can sometimes drive up the CPU utilization. In these types of situations, you will want to do additional performance monitoring to determine why the VM is taxing the virtual CPU.
If on the other hand all of the VMs are consuming excessive virtual CPU resources, but the Hyper-V Hypervisor Logical Processor (_Total) \ percentTotal Run Time counter is at an acceptable range, then you may be able to solve the problem by adding extra virtual CPUs to the VMs.
Finally, check out the Hyper-V Hypervisor Root Virtual Processor \ percent Total Runtime counter. If this value is over 90 percent for all of the root virtual processors, then the host is probably overloaded. If the value is over 90 percent for at least one instance, but not all instances, of the root virtual processor, then you will probably need to enable VMQ on your network adapters. To find out if this is the case, watch the Processor(x)\ percent Interrupt Time and the Processor(x)\ percentDPX Time counters. If the values of these two counters combined are equal to the Root Virtual Processor \ percent Total Runtime counter, then that is an indication that having VMQ disabled on your network adapters is probably the problem.
Counters make it easy to spot processor bottlenecks
As you can see, diagnosing CPU performance issues caused by processor bottlenecks on Hyper-V hosts is relatively easy to do. The three performance counters listed earlier in this article will usually tell you if the host is experiencing a CPU-related bottleneck.
Photo credit: Shutterstock