If you would like to read the other parts in this article series please go to:
- TMG Back to Basics – Part 1: Server Publishing Rules
- TMG back to Basics – Part 3: Protocol Definitions
- TMG Back to Basics – Part 4: Network Objects
- TMG Back to Basics – Part 5: Network Objects (Cont.)
- TMG Back to Basics – Part 6: Reports
- TMG Back to Basics – Part 7: SharePoint Server Publishing
- TMG Back to Basics – Part 8: SafeSearch, URL Filtering and Certificate Revocation Options
Introduction
Continuing our Back to Basics series, this time we’re going to talk about how to use the TMG Firewall log viewer. The TMG firewall, like the ISA firewall before it, is a product that can do many good things. It can serve as a network firewall, forward and reverse web proxy server, remote access VPN server, site to site VPN server, and web anti-malware and URL filtering server; these are some of the key roles the TMG firewall can play on your network. But one feature that might not be apparent to the new TMG firewall administrator is the powerful and useful logging feature. In this article, we’ll provide an overview of the TMG firewall’s logging feature.
There’s no better way to understand how it works than to see it in action. To begin our overview, let’s click the Logs & Reports node in the left pane of the TMG firewall console, as seen in Figure 1 below.
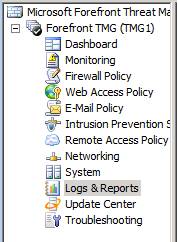
Figure 1
In the Task Pane, on the Tasks Tab, you’ll see a number of options available for configuring and running the logging function on the TMG firewall. Let’s start by clicking the Configure Firewall Logging link in the Tasks Tab, as seen in Figure 2 below.
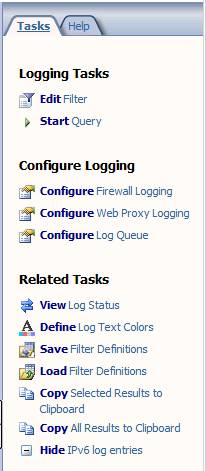
Figure 2
This brings up the Firewall Logging Properties dialog box. On the Log tab, you can choose what type of logging you want to enable. There are three options:
- SQL Server Express Database (on local server)
- DQL Database
- File
The default setting is SQL Server Express Database (on local server). If you want to log to an off-box SQL server, you would select the SQL Database option and then click the Options button to configure what SQL database the TMG firewall would use for logging. If you want to log to a flat file, you can select the File option and then select the file type; in this case, both W3C extended log file format and TMG Log File format are available options.
So how do you decide which is best for you? File logging is faster than SQL logging, but you have limited query abilities on flat file logging, so if you don’t have an off-box SQL database you want to use, I recommend that you use the default logging option. Click the Options button to the right of the SQL Server Express Database (on local server) option, which is shown in Figure 3.

Figure 3
In the Options dialog box, configure the location where you want to save the log files, as shown in Figure 4. The default location is the Logs folder in the default TMG installation folder on the local hard disk, but you can select another location by typing in the full path or browsing for it. You can also configure log file storage limits. The defaults are:
- Limit total size of log files is limited to 8 GB by default
- Main free disk space is set to 512 MB by default – this prevents the hard disk from becoming full with log files
- Main log storage limits by : Deleting older log files as necessary is the default setting when storage limits are exceeded; you also have the option to discard new entries if you prefer to keep the old entries
- Delete files older than (days) is set to 7 by default
Notice that the Compress log files option is grayed out when we selected to log to a SQL or SQL Express database. This is because you can only compress flat file logs.
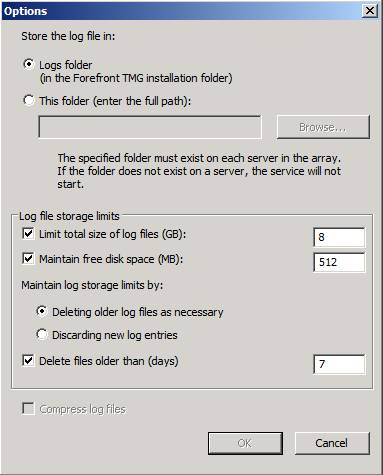
Figure 4
Click the Fields tab, shown in Figure 5. Here you can specify which fields the TMG firewall will log for each of the connections that are logged to the firewall service. If you find that your log files are too large, one thing you can do to decrease the size is to reduce the number of fields that are logged for the connections.
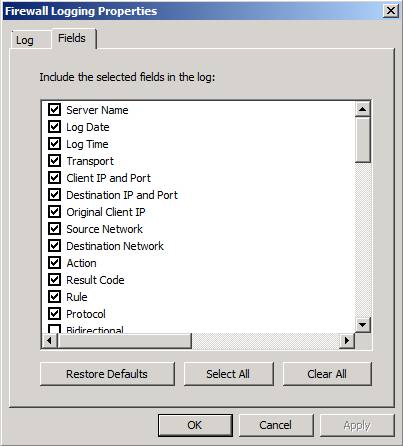
Figure 5
Note that similar options are available when you click the Configure Web Proxy Logging link in the Tasks Tab on the Task Pane.
Now, we will click the Configure Log Queue link in the Tasks Tab on the Task Pane. This brings up the Log Queue Storage Folder dialog box that’s shown in Figure 6. Here you can configure where you want to place the log queue. The log queue is a storage location for log entries that need to wait for the firewall to format them properly. The purpose of the log queue is to allow the TMG firewall to keep log entries that might have otherwise been lost because they were coming in too quickly. With the TMG firewall log queue, these entries are quickly placed in the queue and will wait there until the firewall is able to process the log entries.

Figure 6
Now click the View Log Status link in the Tasks Tab in the Task Pane. This will display the Log Status dialog box, which is shown in Figure 7. You can view the following information here:
- Server shows the server where the log queue is being reported
- Updated Up To shows the time to which the log file has been updated
- Log Queue (KB) shows the number of log entries that are currently in the log queue
- Status shows the status of the log queue
This is all useful information to check when you suspect that you’re getting flooded by a virus or worms.
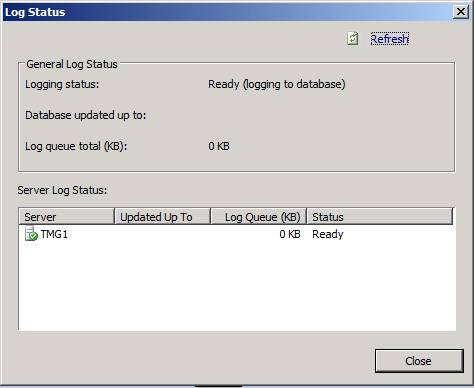
Figure 7
Next, click the Define Log Text Colors link on the Tasks Tab in the Task Pane and you will see the Define Log Text Colors dialog box that’s shown in Figure 8. The default colors are listed here for the most common log file entries of interest. Color coding of the log file entries makes it much easier for you to get a quick visual representations of what how many entries of each type there are, and to find the entries you’re looking for. You can click the Color button if you want to change the color of any of these entries. Another handy feature is that you can use the Export Colors Scheme and Import Colors Scheme button to export and import color schemes from other TMG firewalls.

Figure 8
The Hide IPv6 log entries link in the Tasks Tab on the Task Pane, shown in Figure 9, is a very useful option. When you spend a lot of time reading TMG log files, you’ll find that there are a very large number of IPv6 broadcasts on your network. These IPv6 entries can make the log file very cluttered and hard to “eyeball”. When you click this button, the IPv6 entries will still be logged, but they will be hidden from view so that it’s easier for you to view the log entries without the IPv6 noise.
![]()
Figure 9
Now click the Edit Filter link in the Tasks Tab on the Task Pane. Here you will see that there are three default values:
- Log Record Type is set to firewall or web proxy filter. You typically will not change this.
- Log Time is set to live – you will sometimes want to change this
- Action is set to not equal Connection Status – this helps reduce the noise in the log file filter
In Figure 10 below, you can see that I have selected the Log Time entry and then clicked the down arrow for the Condition drop down box. You will see here that there are many options for filtering the time window for the log file entries you want to see. Note that after you change the value, you will need to click the Update button to change the filtering value.

Figure 10
You can filter the log files by a large number of factors. In Figures 11, 12 and 13 below you can see the options in the Filter by drop down list. When you select a value on this list, you then click the Condition down arrow to select the condition and then you set the Value. After you do these three things, you click the Add To List button so that it will appear in the list of filters.
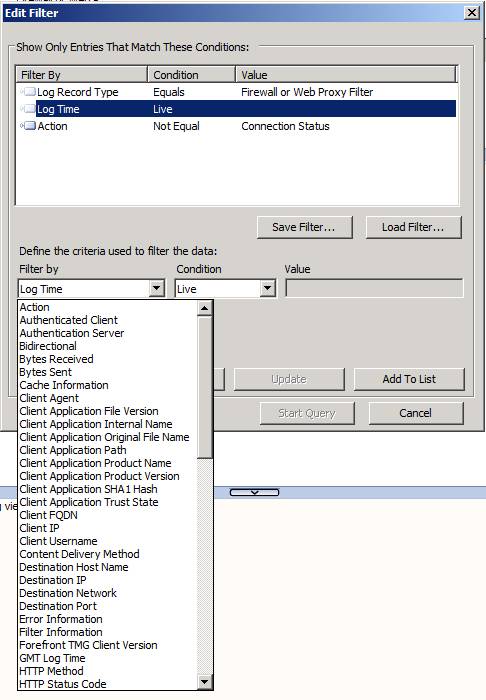
Figure 11
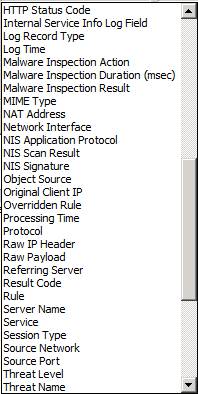
Figure 12
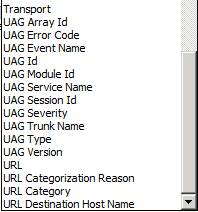
Figure 13
In the Figure 14 below, I selected the Client IP entry in the Filter by drop down list. Then I clicked the down arrow for the Condition drop down box. Here you can see that you have a number of choices, which allows you to drill down to the entries that interest you the most.

Figure 14
After you make the selections you want for the log filter, click the Start Query button. After a while, you will see in the status bar on the bottom on the console that the Query is done and it will show you the number of log file entries that match the parameters of your query, as shown in Figure 15.
![]()
Figure 15
The results of the query will appear in the console and the colors of the entries will match those that you configured in the log colors dialog box we saw earlier. Notice that the names of the fields are in the columns for each of the log file entries, as shown in Figure 16. You can scroll to the right to see the details of each of the log file entries.
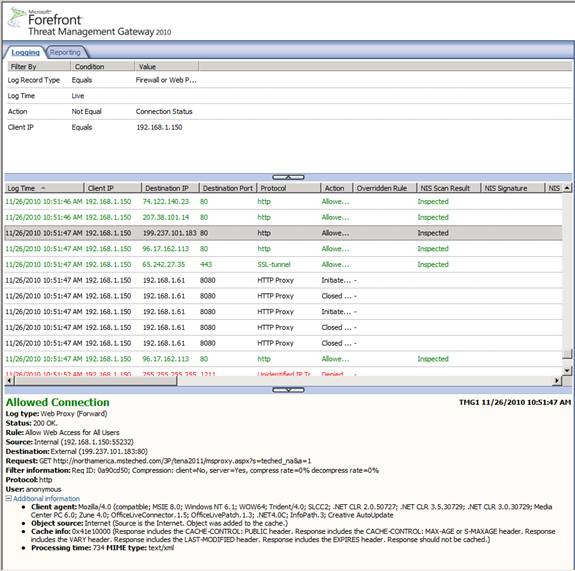
Figure 16
Note that the columns you see at first are the default fields configured to be displayed. If there is a field that you’re interested in and it doesn’t appear, you can right click one of the columns and click the Add/Remove Columns command, as seen in Figure 17 below.

Figure 17
This brings up the Add/Remove Columns dialog box. On the left side is a list of Available columns, which you can see in Figure 18. Scroll through the list and find the field(s) that you’re interested in and then click the Add button to move it to the Displayed columns section. Click OK and then return to the console. Now scroll to the right and you’ll see the information for those columns you added listed for the log file entries you filtered. Nice!
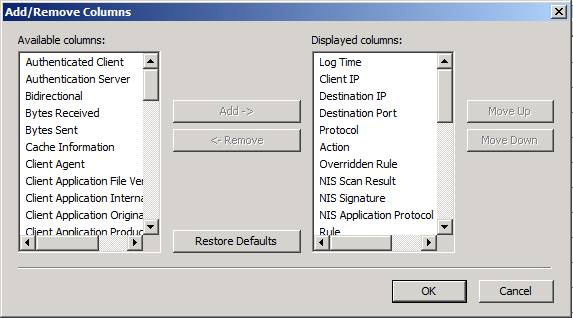
Figure 18
When you click on a log file entry, you can see more details in the details section under the list of the log file entries. In Figure 19 below you can see detailed information about the entry, including valuable HTTP and proxy related information in the Additional information section.

Figure 19
Summary
In this “Back to Basics” article, we showed you a high level overview of the logging and log filtering features that are included with the TMG firewall. As you can see, the TMG firewall logs a great deal of information about each connection made to and through the TMG firewall. You can use the log viewer to drill down to the entries that are of most interest to you and the filtering process is comprehensive and very easy to configure. I hope you enjoyed this overview and if you have any questions about how to use the logging and filtering feature included with the TMG firewall, let me know! Write to me at [email protected] and I’ll get back to you as soon as I can. Thanks!
If you would like to read the other parts in this article series please go to:
- TMG Back to Basics – Part 1: Server Publishing Rules
- TMG back to Basics – Part 3: Protocol Definitions
- TMG Back to Basics – Part 4: Network Objects
- TMG Back to Basics – Part 5: Network Objects (Cont.)
- TMG Back to Basics – Part 6: Reports
- TMG Back to Basics – Part 7: SharePoint Server Publishing
- TMG Back to Basics – Part 8: SafeSearch, URL Filtering and Certificate Revocation Options


Under windows 2003 R2 and ISa server 2004 I could enable IKe tracing of site to site vpn with this command:
netsh ipsec dynamic set config ikelogging 1
then I could read the Oakley file to understand unexpected negotiation errors
Under windows 2008 R2 and Forefront TMG 2010 it not works.
What can I do ?
thanks