Network admins rejoice! Azure Network Watcher is giving you a great gift, allowing you to diagnose network issues and access logs all under your Azure infrastructure.
Let’s dive into the different features it offers.
Topology
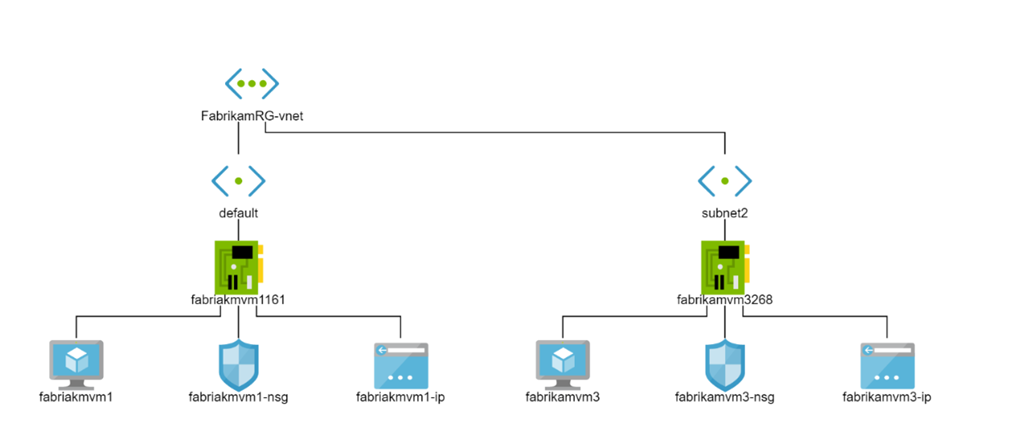
As seen in this sample topology of a web application, a network topology can be easily visualized so that you know exactly where your different nodes sit across the entire setup of your infrastructure.
IP flow verify
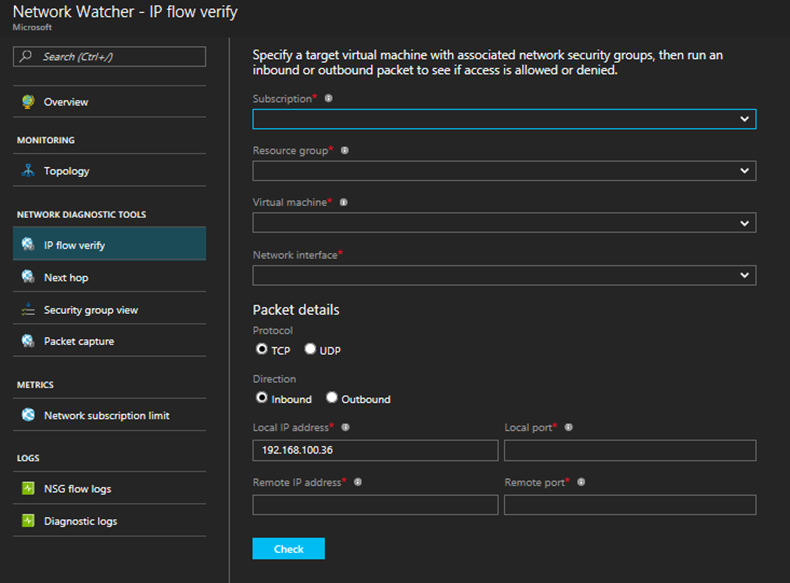
Is a flow allowed or denied from a virtual machine? The tool below allows you to review the source IP, destination IP, source port, destination port, and protocol to validate the flow.
Next hop
Where’s your next traffic hop going to? With this tool, you’ll see the next hop type and IP address based on a specific virtual machine so that you can investigate any configuration issues.

Security Groups
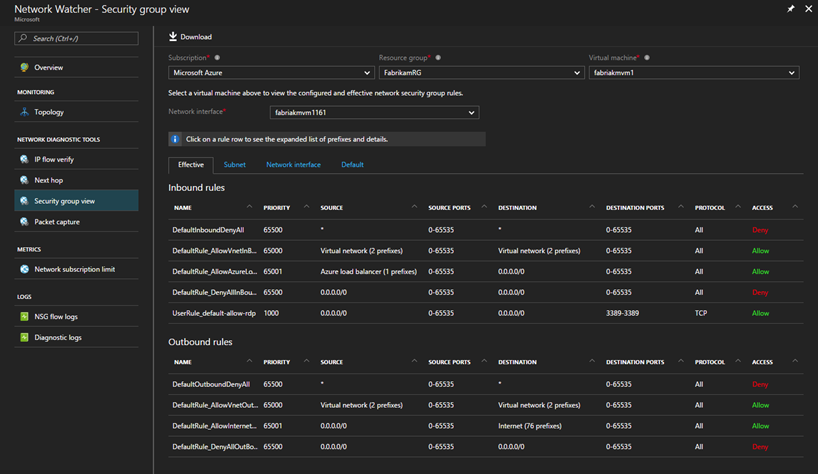
Perhaps the most exciting feature (for me at least) is the security functionality that lets you ensure that your network is compliant with regularly governance protocol and your IT security rules. Using this feature, you can access all security rules that are active and configured, as well as review which ports are open or closed. You can also programmatically audit security rules.
Packet capture
Capturing packets helps network admins troubleshoot network issues. Network Watcher lets you trigger packet capture based on criteria such as source IP, destination IP, source port, destination port, or byte offset from the packet.

Network Subscription limits
Want to see your usage against your network subscription limit? That’s available too:

NSG flow logs
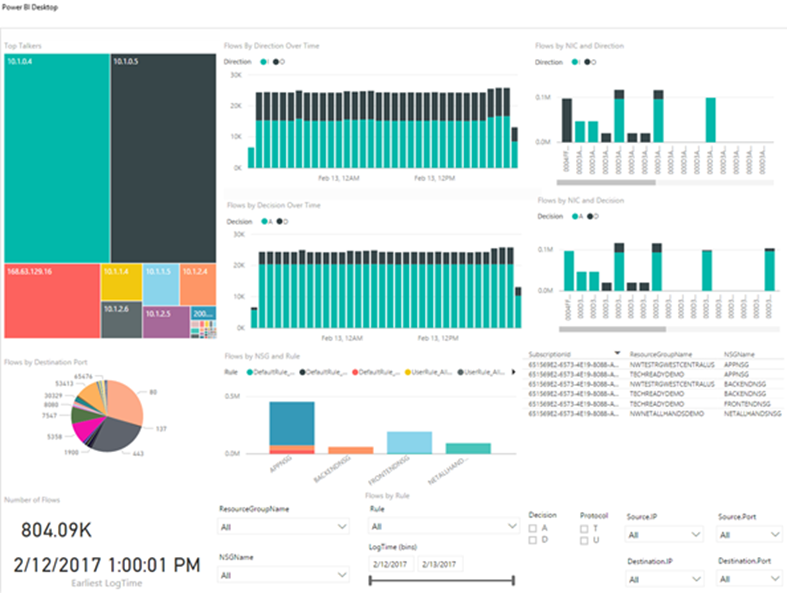
Log your Network Security Group flow data with this feature. The logs will contain a timestamp, source IP, destination IP, source port, destination port, protocol, the Network Security Group, and the security rule. You can also view it in a more glorified manner using Power BI or through third party event management tools.

This is what you can do with the right Power BI scripts. Pretty sweet.
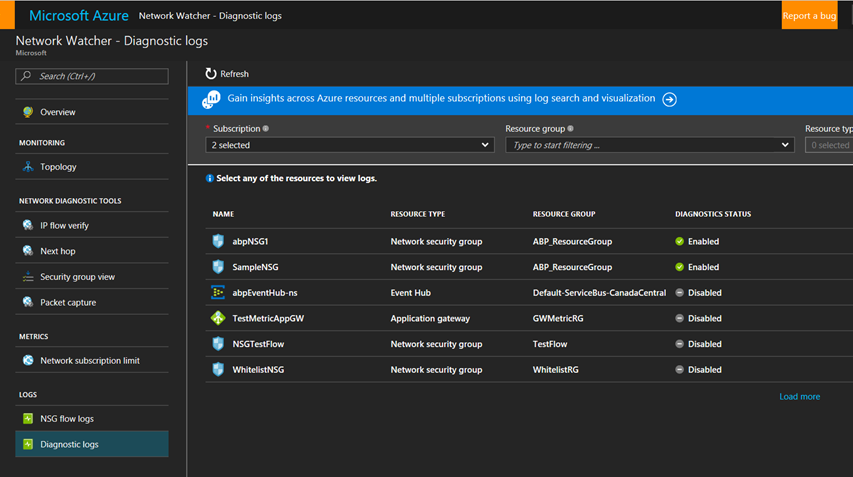
Diagnostic logs
Diagnostic logs can also be configured to capture all network resources from a single pane.
Just the beginning
The Azure Network Watcher utilizes a Virtual Network Gateway to connect between your on-premises solution and Azure VNets and will help troubleshoot issues that arise during the communication. Azure Network Watcher already has several built-in tests that address more than fifteen fault conditions with the results being logged to storage of your choice so that you can address and solve the issues.
Integration is supported with a plethora of Azure services, such as Azure Automation, Azure Functions, and Azure Log Analytics. Third party tools are also available and include Splunk’s valuable insights, Observable Networks network appliance, Sumo Logic to recover network vulnerabilities, and others to come.
Currently, it’s available in US West Central, US North Central, and US West.
Photo Credit: Shutterstock, Microsoft