
Time-series databases (TSDBs) have exploded in popularity over the past several years, and so has Kubernetes. To monitor Kubernetes, you can use Prometheus, the popular TSDB. Why is this tool so popular, and why is it becoming synonymous with Kubernetes by association?
You may also wonder what metrics this tool monitors in an infrastructure as vast and complex as Kubernetes’? In this guide, I’ll answer these questions and show you the most important Kubernetes metrics to monitor.
Prometheus: An Overview
Prometheus is an open-source tool for monitoring and alerting metrics-based systems. It records and processes any solely numeric time-series data. It also has a multidimensional data model. Prometheus calls out to your target and pulls or ‘scrapes’ metrics from these targets. To do that, it sends HTTP requests to their metric endpoints. Then, it stores them in a time-series database.
The targets can be your company’s instrumented applications or third-party applications. This tool also offers you a flexible query language to leverage its multidimensional data model. It also provides detailed and actionable metrics to help you analyze your applications’ performance. It can also collect millions of metrics per second, so it’s perfectly suited for your complex workloads.
What Is Time-Series Data?
Time-series data is a set of data points associated with time stamps. That means they’re collected over regular time intervals. In turn, they enable you to track changes over time, milliseconds, days, and years. It records each and every change to the system, but it doesn’t just include time as a metric. Instead, time is a fundamental component that helps you analyze data. The derived actionable insights also enable you to measure and analyze change.
Now, let’s talk about why it’s important to monitor your Kubernetes environment.
Why Use Prometheus for Kubernetes Monitoring?
Kubernetes is a complex and dynamic system with a busy production environment, so it needs monitoring strategies and tools. You also need to choose tools with advanced capabilities. That’s where Prometheus comes in. It’s an application built for monitoring cloud-native environments with heavy workloads.
Check out these 5 reasons why Prometheus fits Kubernetes monitoring like a glove.
1. Service Discovery
Since Prometheus has a pull model, it systematically scrapes your targets. That way, your applications don’t have to fret about emitting data. Its servers also have various methods that auto-discover targets to scrape. At that, you can configure some Prometheus servers to filter and match container metadata.
2. Multidimensional Data Model
In the same way Kubernetes uses labels to organize infrastructure metadata, Prometheus uses key-value pairs. That means it can collect and analyze Kubernetes’ time-series data accurately.
3. Modular and Highly Available Components
A composable service carries out alerting, graphical visualization, metric collection, and more. Each of these services helps support redundancy and sharding. That way, you ensure you’re always receiving the proper alerts.
4. Accessible Format
Prometheus has a simple way of exposing its metrics. It’s also self-explanatory, so you can read it yourself. The metrics can be published via a standard HTTP transport, and you can use your web browser to verify if the metrics are correctly exposed.
5. Prometheus Is Free
It’s completely free, so it doesn’t just have a ‘free-tier’. That means you can benefit from this powerful asset to enhance your business, without much worry.
Basics of Monitoring Kubernetes with Prometheus

Let’s neatly wrap up how Prometheus functions.
First, Prometheus discovers targets to scrape from using Kubernetes Service Discovery. Then, it sends an HTTP request–a scrape–according to the configuration defined in the deployment file. The response to this is then stored and broken up in storage, which is a custom database on the server. This storage also contains the metrics for the scrape request itself. Now, you need to properly expose and configure this data.
Prometheus also collects application metrics and metrics related to Kubernetes services, orchestration status, and nodes. Then, a node exporter exposes host-related metrics, like CPU usage, memory, disk space, network, and bandwidth. Now, kube-state-metrics exposes the orchestration and cluster-level metrics, like pod metrics, deployments, etc. Lastly, the embedded cAdvisor exporter can expose cgroups metrics.
At this point, you can access the collected data using PromQL, which you can also configure to trigger alerts. I also suggest you export the collected metrics into graphical interfaces like Grafana. In turn, that can pull metrics from multiple servers to display dashboards and panels. The AlertManager sets up the gateways to deliver and manage alert notifications and grouping.
Let’s now look at the key metrics you should monitor to gain insight into your Kubernetes infrastructure.
Keep an Eye on These 5 Key Kubernetes MetricsWith Prometheus
As we’ve established, monitoring your Kubernetes environment is important, but it could go to waste if you don’t use it efficiently. That’s why I’ve curated a list of the top 5 metrics to monitor in your K8s environment. Let’s take a look.
1. Watch the Kubernetes Cluster Metrics
It’s important to have a high-level view of your cluster and its state. That allows you to keep track of the running pods, nodes, and containers. Tracking cluster metrics also helps you understand if pods are being launched, maintained, and scheduled properly. You can also discover surface issues with nodes or pods, and look out for bottlenecks. You’ll also get a clear representation of the deployed workload. A few important cluster metrics I advise you to look into are memory usage, disk usage, CPU usage, and network I/O pressure.
2. Monitor the Kubernetes Container/Pod Metrics
I always recommend monitoring your pods’ resource allocation because it can directly affect your application performance. You also need to be aware of the availability and unavailability of pods, given that many unavailable pods indicate poorly configured readiness probes. Keep an eye on the number of desired and current pods, too. That’s because a large difference between the two indicates bottlenecks and failing pods. Finally, you should examine the number of under-provisioned and over-provisioned pods. Kubernetes container metrics also help you track the restart activity of containers to ease troubleshooting issues.
3. Track the Kubernetes Node Metrics
Since the running pods can only leverage a finite capacity of CPU and memory for each node, it’s important to monitor them closely. Node-network traffic and disk-space usage are also among other important things I suggest you track.
4. Check the Kubernetes Internal Metrics
The Kubernetes cluster panel is responsible for many things. For example, it monitors your cluster and schedules/assigns workloads to worker nodes. It also tracks the life cycle of different controllers deployed to the cluster and ensures that the cluster runs in its desired state. That’s why it’s critical to ensure that your cluster’s central nervous system is healthy.
5. Study the Application Metrics
You can instrument the applications running in Kubernetes through RED (Request rate, Error rate, and Duration) metrics. Memory, JVM, Threads, and Heap are also a few other application metrics that you can monitor to make sure it’s running correctly.
Visualize Prometheus Metrics with Grafana
Although Prometheus is a great toolkit for monitoring metrics, I find its graphing and dashboard are under par. This is where Grafana shines bright! Grafana creates beautiful and interactive dashboards with your data. I also use Grafana to assimilate data from a huge number of sources. Then, it’ll query it and display it on customizable charts that suit my style. To sustain the Prometheus-Grafana relationship, Prometheus collects string metric data, and Grafana analyzes and visualizes this data.
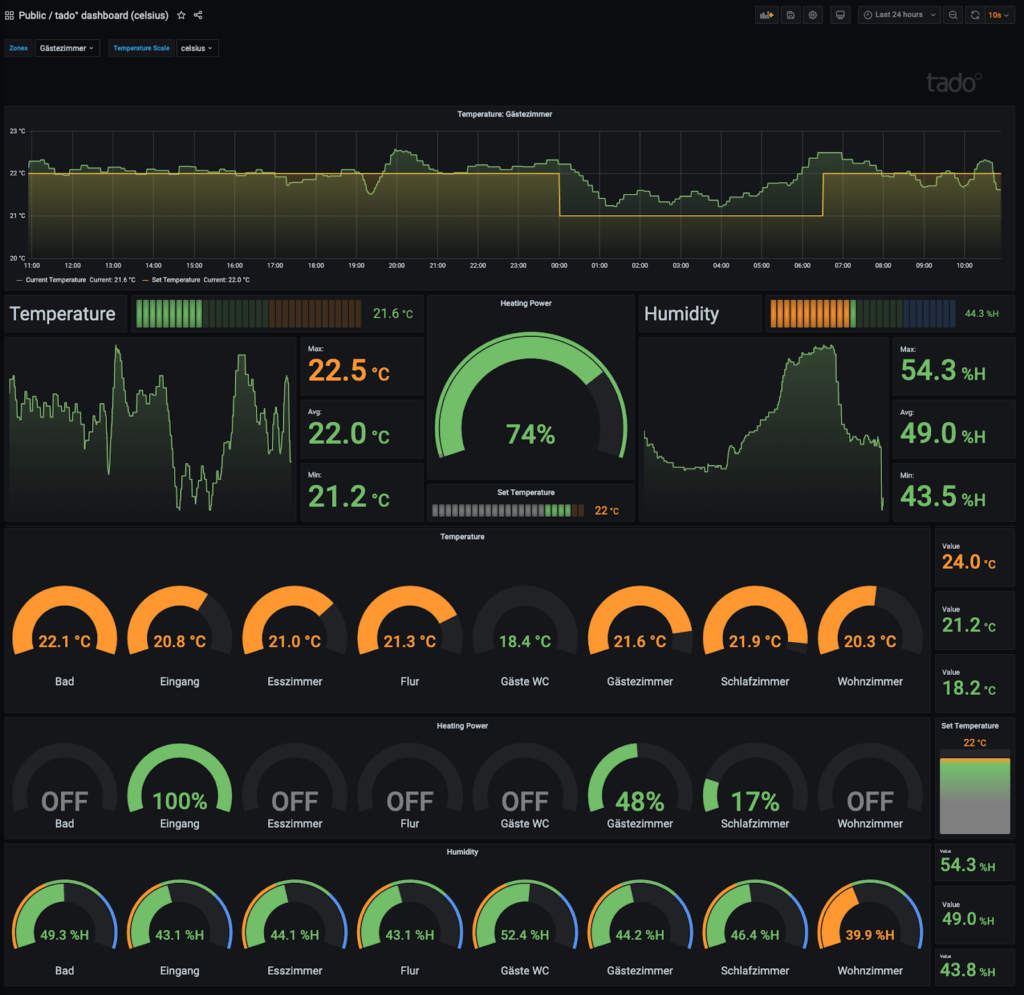
Grafana also has built-in support for numerous different storage options, called data sources. Data sources feed metric data collected from applications into Grafana, and Prometheus happens to be one of the most popular data sources.
To sum up, Prometheus pulls and stores information from Kubernetes by monitoring it based on a few metrics. Then, it stores this data and inserts it into Grafana to develop beautiful and dynamic graphs and dashboards. That helps you visualize the Kubernetes metrics you’re monitoring.
Send Prometheus Metrics to Third-Party Monitoring Applications
Prometheus is an excellent tool for gathering high-level metrics, critical for monitoring the health of your applications and services, but it still has its limitations. This tool only tells you “what” is wrong with your system, but it doesn’t show you the “why”. Apart from this, Prometheus also faces visibility, storage, and data aggregation related challenges when scaled. That’s why you can also use third-party tools to mitigate these challenges. For example, I could recommend using DataDog, New Relic, Sumo Logic, etc., to get a holistic view of your Kubernetes system.
Final Thoughts
Kubernetes is very operationally complex, so you need to constantly track your system’s overall health, behavior, and performance. This means it’s key to create a monitoring strategy, but remember the top metrics to monitor. I also advise using powerful monitoring systems, designed from the ground up to work with dynamic and complex environments. The open-source Prometheus is key to enabling monitoring for Kubernetes, and it’s your starting point to get essential Kubernetes performance metrics. That way, you can ensure your environment is running smoothly and that you’re proactively addressing any issues that pop up. Combine Prometheus, Grafana, and other tools to create the optimal Kubernetes monitoring system!
FAQ
How does Prometheus capture monitoring data?
Prometheus captures monitoring data in 2 methods, through instrumentation or agents. Instrumentation adds custom code into the monitored application’s source code. Agents automatically translate application data into metrics. They run side-by-side with applications in a shared environment.
How does Prometheus scrape metrics from pods?
Prometheus collects metrics via a pull model, so you simply have to expose a web port and design a REST API endpoint. This endpoint will also expose the Prometheus-format metrics. Then, the tool will use its auto-discover plugins to gather, filter, and aggregate the metrics.
What type of metrics does Prometheus collect?
Here are the 4 primary metric types that Prometheus collects:
- Counters: They’re one of the most fundamental metric types that help track and assess values that can only increase.
- Gauges: They’re similar to counters, but they measure metrics that rise and fall over time.
- Histograms: They sample observations, request durations, response sizes, and the like by their frequency. It also counts in buckets and provides the sum of all observed values. These buckets help track an attribute’s distribution over several events. Histograms are highly performant: they only need a count per bucket.
- Summaries: They show the total count of observations and the sum of observed value. Summaries are similar to histograms as it also tracks the distribution of attributes over many events. Yet, they’re different from histograms, as they expose quantile values directly.
Can Prometheus monitor multiple Kubernetes clusters?
Yes, it can. You can have a Prometheus instance in each cluster and one central Prometheus to gather it all. Conversely, you can have a single central Prometheus scrape all the clusters.
Where is Prometheus data stored?
Prometheus stores data on its local on-disk time-series database. It could also store it on remote cloud storage when it integrates with them. That, in turn, gives you flexibility in where to store your monitoring data. It also enables you to save on storage costs.
Resources
TechGenix Website
Visit the TechGenix website for more trending technology news.
Getting Started with Kubernetes
Read how you can set up local Kubernetes clusters to get started with the system here.
Looking for more open-source monitoring tools for Kubernetes?
Check this article on the top open-source projects for Kubernetes monitoring.
Prometheus’ official website
Learn about how Grafana and Prometheus work together.
Prometheus is not a solo player in the game
Read about why you need more than just one tool to monitor Kubernetes.