Did you recently transition to a microservice infrastructure? Did you face issues selecting the right Kubernetes monitoring tools while you’re at it? These tools provide you with top-level visibility of your entire data environment. They also help you administer performance and maintenance activities on data structures and facilitate usage report creation. Getting the right one for your unique infrastructure can be critical for operational success!
To benefit from all Kubernetes’ advantages, companies and communities are stepping forward to launch open-source monitoring tools. To help you pick one, we’ve compiled a list of the top 6 open-source Kubernetes monitoring tools. In this article, we’ll discuss each tool’s advantages and pitfalls. You’ll also find tips on how to integrate them into your infrastructure. We’ll take you through cluster and internal metrics, as well, to ensure you don’t miss a beat!
First, let’s go through why you need a Kubernetes monitoring solution in more detail.

Kubernetes Monitoring and Why It Matters
Monitoring is essential to know what’s happening at any time within your Kubernetes system. It’s a bit like driving, meaning you need clear visibility. Imagine driving in the fog on a road with hairpin bends and no fog lights! It’s the same concept for your data management; you can’t monitor it without essential Kubernetes monitoring tools. Anything can happen, from uncatered-to data overheads to overlooking resource-consuming injection attacks. Your system can be in peril because of what you don’t know.
Key Monitoring Metrics
Metrics give you an overview of your system’s performance, enabling you to make the precise changes you need. The metrics range from network bandwidth information to security vulnerability analysis. All these are critical to operating a Kubernetes system.
Since you’re likely running Kubernetes in a cluster environment, here are the key metrics you need when managing this environment. If you aren’t using a cluster environment, most metrics still apply except inter-node I/O.
Cluster Metrics
Metrics should help you get a clear picture of the deployed workload in a Kubernetes cluster. You’ll need information on the number, health, and availability of pods and containers. That way, you’ll analyze your Kubernetes groups and storage. These metrics will also help you assess your software packages, including code, libraries, and other dependencies. That means you’ll get an in-depth view of your cluster.
Other metrics help you uncover data like the number, readiness, memory, and network availability of your cluster environment’s nodes. Nodes are servers that host all data and applications in Kubernetes. The more nodes you have, the more queries and users the system can handle. Metrics also help reduce data loss risk on the system down events due to the replication activities taking place between nodes.
Once you know this information, you’ll also need the system’s hardware utilization. These include data on memory utilization, CPU utilization, disk, and network I/O overhead. This information helps you analyze if the resource utilization in the cluster environment is adequate and balanced across nodes.
Resource utilization is the number of system resources in use and resources available for use at any time. It’s good to remember that some programs add logs while others don’t shut down correctly. If you’ve exceeded the number of systems in use, the system will fall over, even resulting in a system shutdown. Clusters can compensate, but only until replication spreads across nodes. That’s why monitoring cluster environments is essential!
It’s also key to monitor the control plane components run through the master nodes, like API server, controller scheduler, and Etcd. That way you’ll get a detailed view of the cluster performance.
Now that we’ve covered the basics about Kubernetes monitoring, let’s dive right into the top tools in this exciting space.
Top 6 Tools in the Kubernetes Monitoring Space
1. Prometheus

Prometheus is an open-source, enterprise-grade monitoring tool for containerized environments. It helps monitor thousands of machines simultaneously with a single server. Prometheus also provides comprehensive metrics without affecting the containers’ system performance during monitoring.
The following table identifies Prometheus’ main features:
| Prometheus’ Main Features | |
| Service |
|
| Workflow |
|
| Incident |
|
| Agents |
|
How Does Prometheus Extract Metrics?
Prometheus can access data directly from an application’s client libraries. It starts by using the Kubernetes API to discover targets. Then, it retrieves machine-level metrics from the application information. At this point, you can access the data using the PromQL query language and export it to a graphical interface for analysis.
2. Sensu
Sensu is an open-source infrastructure and application monitoring tool. It provides an in-depth understanding of how containers, services, servers, and connected devices operate in the cloud. Sensu also offers an end-to-end observability pipeline where you can collect and transform monitoring events and send them to any database you wish. That way, you have more options to store and analyze your monitoring data. That’s great for monitoring since it’s better to have multiple views for your data.
Sensu has a simple setup and provides cluster health and visualization. It can also run in parallel with Prometheus in your Kubernetes cluster or natively without it. That’ll give you different perspectives on the same data and help you troubleshoot issues faster.
The following show Sensu’s main features:
| Sensu’s Main Features | |
| Service |
|
| Workflow |
|
| Incident |
|
| Agents |
|

3. OverOps
OverOps aims to solve the issues resulting from a lack of monitoring in containerized applications. It helps identify, prevent, and resolve critical software issues in these applications.
The tool continuously monitors and analyzes code for anomalies at runtime. Its value-add is that it analyzes code at runtime and captures the full Java virtual machine (JVM) state without relying on logs or other metrics. That way, it uncovers issues that other monitoring tools missed.
An exciting OverOps feature is the automated root cause (ARC) screen. It enables pinpointing specific lines of code, container state, and deployment as the root failure mechanism. When it encounters an anomaly, OverOps sends alerts, ensuring the relevant personnel know about it. This helps developers get in-depth knowledge about the complete container state at the same moment an error occurs. That also helps resolve errors before aggravating the situation and, worse, impacting customers.
The following shows the main features of OverOps:
| OverOps Main Features | |
| Service |
|
| Workflow |
|
| Incident |
|
| Agents |
|
4. Grafana
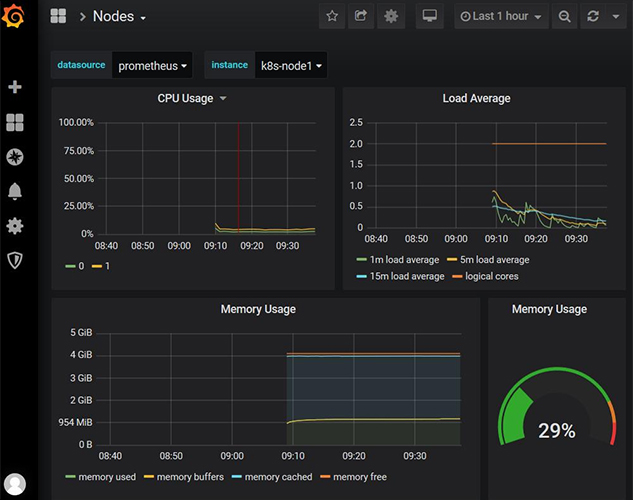
Grafana is an open-source multi-platform tool for monitoring and observation. It helps monitor data over a period of time and connects with every available source. It also supports dynamic dashboards with many graphs, histograms, Geo maps, and template variables. That way you can visualize metrics and logs quickly and in multiple ways.
The tool features a built-in alert system that enables you to visually define alert rules for critical metrics. It also enables data-source-specific queries that help specify and identify a data source on a per-query basis. This is done by mixing different data sources in the same graph.
The following shows the main features of Grafana:
| Grafana Main Features | |
| Service |
|
| Workflow |
|
| Incident |
|
| Agents |
|
5. Graphite
Graphite is an enterprise-level monitoring tool for time-dependent metric analysis. It stores numeric time-dependent metrics and then renders graphs. Graphite doesn’t collect the data; instead, a component called Carbon passively listens.
The following shows Graphite’s main features:
| Graphite Main Features | |
| Service |
|
| Workflow |
|
| Incident |
|
| Agents |
|
6. Datadog

Datadog is a monitoring and observability tool that helps monitor, troubleshoot, determine, and optimize application performance. It extracts metrics, logs, events, and service states from Kubernetes in real-time.
You also can use Datadog to automatically search and analyze logs for troubleshooting and open-ended data exploration. Its UI offers customizable dashboards showing graphs composed of multiple data sources in real-time.
The following shows the Datadog’s main features:
| Datadog Main Features | |
| Service |
|
| Workflow |
|
| Incident |
|
| Agents |
|
The Verdict
We can draw some conclusions from the above. One is that Prometheus is the leading Kubernetes monitoring tool along with Grafana. These help to visualize monitoring data, making management easier. Another conclusion is that other Kubernetes monitoring tools, like Datadog and Sensu, can be powerful when tied together to form an entire monitoring toolchain. Your choice depends on what metrics you need to monitor and your use cases.
Final Thoughts
Kubernetes monitoring tools help you achieve top-level visibility for your data. So, you also can choose the appropriate tools based on your unique needs and use case. That said, the Kubernetes ecosystem is constantly growing and has even become quite crowded lately.
If you’re new to Kubernetes monitoring tools, Cloud Native Computing Foundation (CNCF) projects, like Prometheus and Grafana, are good choices. They have a large and active community backing them and constantly evolve to bring better solutions. Once you’re up to speed with these, you can graduate to more robust and feature-packed paid tools, like Datadog.
So, when it comes to monitoring, having the right tool mix in your arsenal is vital. This article gives you an overview of the best options you can choose from.
FAQ
How do you monitor Kubernetes?
You can track key metrics for containers, pods, nodes, networking, availability, and security. The community offers diverse tools that are well-integrated and purpose-built for Kubernetes. Use our guide to check the top 6 open-source Kubernetes monitoring tools. Through monitoring and managing data, you ensure your system is working at peak efficiency.
What are the tools for container monitoring?
Prometheus is the leading Kubernetes monitoring tool along with Grafana. These help to visualize monitoring data, making management easier. Other tools, like Datadog and Sensu, can be powerful when tied together to form an entire monitoring toolchain. This gives you granular detail about program performance on a Kubernetes system.
How do I check Kubernetes’ performance?
Kubernetes’ performance depends on the performance of the containers, pods, nodes, and network. Identify key metrics on their health, availability, and utilization to improve Kubernetes’ performance. Failing to monitor the system’s health may mean one or more nodes fall over, impacting users.
How fresh should your Kubernetes monitoring data be?
Real-time data is the standard and a must for cluster environments. Prometheus excels at delivering time-dependent data for Kubernetes in real-time. Some alternate tools may have a few seconds of delay, but anything beyond this is unacceptable in the Kubernetes world. The better the resolution you achieve, the more likely you’ll assess a system’s performance effectively.
What is the best free monitoring tool for Kubernetes?
Prometheus is the best and most powerful Kubernetes monitoring tool available today. It delivers time-based data that reports on Kubernetes’ health and performance in real-time. This means you don’t lose key data for analytics, ensuring you never miss a beat!
Resources
Best friends: Kubernetes & Prometheus
Read about why Kubernetes and Prometheus are better together.
More Open-Source Monitoring Tools
Check this list for more open-source tools that monitor Kubernetes.
Kubernetes Monitoring Startups
Get to know the top Kubernetes monitoring startups here.
Prometheus’ Official Website
Discover more about Prometheus from their official website.
Datadog’s Official Website
Learn more about Datadog from their website.


Stella ms excel password recovery software is the fast password recovery software to recover all excel file password using three best password recovery methods this software is recover all encrypted password of the excel file this software is recover all key combination excel file password without deleting any excel file this software is support all version 32bit and 64bit excel file and also recover all workbook and worksheet password without deleting any excel file items. For more info visit this link https://www.stelladatarecovery.com/recover-excel-file-password.html
https://www.excelunlockers.com/