
Source: Pixabay
How do you find out if your virtual machine is using the right amount of resources? Sure, you can use Windows Server’s performance monitoring tools and Hyper-V Manager to figure out your VM’s resource consumption. However, you’ll find that their results often don’t tally.
Although mainstays of the Windows OS, these tools tend to mislead with their measurements. They provide conflicting measurements when used in a Hyper-V environment. In that case, which administrative tool’s measurements should you believe?
You can’t blame the tools for doing what they do. The blame lies in how you use the tools and to what end. In this article, I’ll share 3 of my best practices for monitoring performance in a Hyper-V environment.
3 Hyper-V Performance Monitoring Best Practices
You have 3 best practices you can refer to when monitoring the performance of your Hyper-V environment.
1. Know What You’re Measuring
The first rule for performance monitoring a Hyper-V environment is to know what you’re actually measuring.
Countless blog posts warn against running the Performance Monitor inside the Hyper-V VM. But, I haven’t found it to be a problem. You’ll be fine if you know what you’re measuring.
So, why do people advise against running the Performance Monitor inside a VM? The primary reason is the conflicting resource consumption reports.
Instead of showing you the true resource consumption, the Performance Monitor (when run inside a VM) shows you relative consumption stats.
Demonstration
For demonstration, I created a Windows 11 VM on a Hyper-V host. Then, I started the Performance Monitor from inside the VM. Once started, I monitored how much CPU power the VM used.
Next, I downloaded the CPU Stress tool from Sysinternals. This tool places a load on the VM’s CPU, so we can test it to its maximum capacity. As shown in the figure below, this tool maxed out the VM’s CPU.

With the CPU at max capacity, I switched to the Hyper-V Manager. As shown in the figure below, the Hyper-V Manager shows the VM running at only 12% CPU capacity.

Now, if I run the Performance Monitor on the Hyper-V host, it’ll show a 0% average CPU load.

So, to summarize, the Performance Monitor shows 100% CPU load when run from inside the VM. However, it shows 0% CPU use when run from outside the VM. As you can see, both these results conflict with each other. To further complicate matters, the Hyper-V Manager shows 12% CPU use for the VM.
So which measurement should you believe?
Actually, all of them are correct.
First, the measurement from inside the VM shows that the machine is at 100% of the CPU resources that it’s been allocated.
Second, the Hyper-V host level measurement shows that the parent OS is using none of the allocated CPU resources. This means the OS is unaware of the resources being consumed by the VM.
Finally, the Hyper-V Manager shows the VM using about 12% of the physical server’s total CPU resources.
2. Use the Right Counters
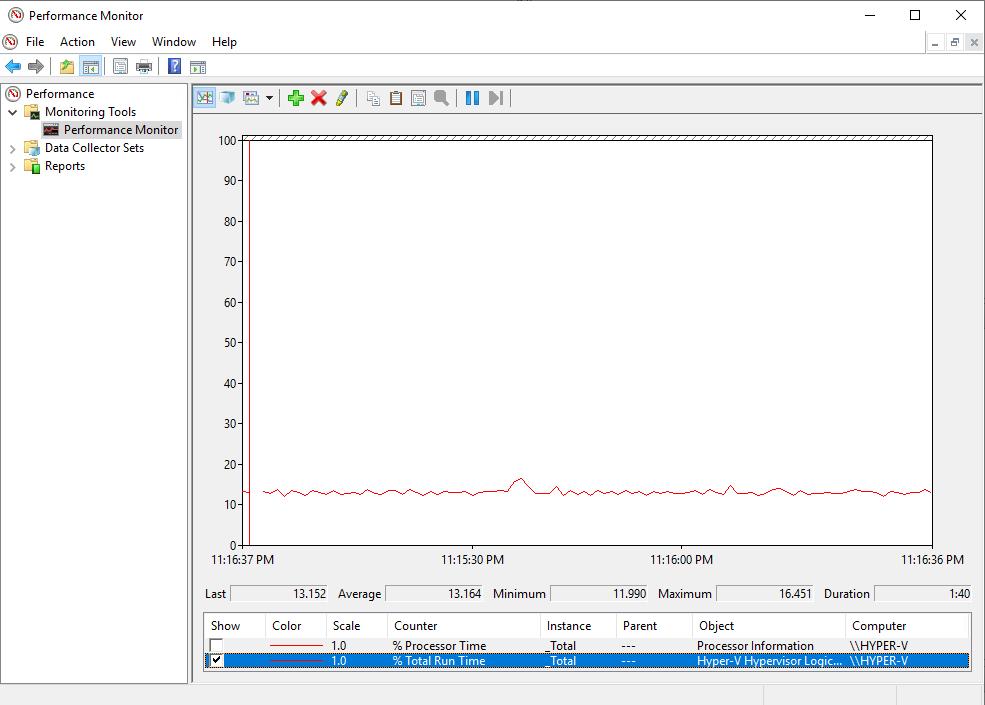
My second best practice for performance monitoring is to use Hyper-V aware Performance Monitor counters. Performance counters examine a program’s resource use. The Hyper-V Hypervisor Logical Processor %Total Run Time is a counter that measures the load on the CPU.
Let’s see what it does.
You run the Performance Monitor on the Hyper-V host. Use the counter mentioned above to find your VMs CPU resource consumption.
As shown in the figure below, this counter shows a result that’s in line with what the Hyper-V Manager shows.
3. Know What’s Normal for Your VMs
My third best practice for Hyper-V performance monitoring is to know your VM’s normal measurements.
This is what performance monitoring is all about. For instance, when you introduce and run a new workload online, collect its baseline measurements using the Performance Monitor.
That way, if the workload exceeds its resource capacity, you can compare it to the baseline value.
Let’s wrap up!
Final Thoughts
Different administrative tools in Windows Servers give different results for CPU resource consumption. It can be confusing to deal with this problem. If you find yourself in such a situation, use the strategies I discussed in the article.
As a rule, always know exactly what you’re trying to measure with these tools.
Additionally, use the right counters when measuring your virtualized environments. The right counters will give results that align with your Hyper-V Manager’s reports.
Finally, record the baseline for any new workload you add to your Hyper-V environment. This will be the benchmark against which you’ll measure resource consumption problems if they arise.
Do you have more questions about verifying your Hyper-V host’s resource health? Check out the FAQ and Resources sections below!
FAQ
What does the Sysinternals CPU stress tool do?
The Sysinternals CPU Stress tool creates threads. You assign activity levels to each of those threads. This allows you to place a heavy load on the CPU. Therefore, you can use it to stress-test the system to assess its overall performance.
Why does the Hyper-V Hypervisor Logical Processor %Total Run Time counter display a different value than the %Processor Time counter?
The %Processor Time counter shows the load the host’s CPU is bearing. Simply, how much the parent OS is loading the CPU resources. On the other hand, the Hyper-V Hypervisor Logical Processor %Total Run Time counter shows the load put by the VMs on the host.
What is a healthy value for CPU utilization?
Windows Server experts give different opinions on what the right CPU load is. I’ve read some articles advising against going above 75% load. Others claim that 90% CPU load is acceptable. In my opinion, if a Hyper-V VM averages more than 80% CPU load (when measured from inside the VM), then you should add more CPU resources to the VM.
What’s the advantage of using the Task Manager instead of the Performance Monitor?
Task Manager can also measure a Windows PC’s performance, much like the Performance Monitor. However, the Task Manager is suited for basic monitoring. On the other hand, the Performance Monitor does more of a granular type of monitoring.
What’s a native tool that’s a mix of both the Task Manager and the Performance Monitor?
The Resource Monitor is a good in-between tool. Although it isn’t as granular as the Performance Monitor, it’s easier to use. Moreover, it provides a bit more detail than the Task Manager.
Resources
TechGenix: Article on Business Performance Metrics
Learn about the top IT metrics to maximize business outcomes and performance.
TechGenix: Article on Network Monitoring Optimization
Read more on how to take your network monitoring to the next level.
TechGenix: Article on VTune Profile Performance Analyzer
Find out how to use the Intel VTune Profiler performance analyzer on Hyper-V VMs.
Microsoft: Article on How to Detect Bottlenecks in Virtualized Environments
Discover what Microsoft recommends with regard to detecting bottlenecks in virtualized environments.
Microsoft: Article on Hyper-V Architecture
Read more on Hyper-V architecture.