Product Homepage: click here
Free Trial: click here
GSX Gizmo provides monitoring of Microsoft 365 and on-premises services by interrogating services directly, and by using distributed agents across your environment to provide visibility into real-life performance. In a world of distributed employees and heavy usage of Microsoft Teams, IT teams need tooling to provide insights into problems before they become critical incidents.
In this review, we’ll take a look at the capabilities of the latest version of GSX Gizmo, including its advanced capability for services and Microsoft Teams.
Challenges with understanding Microsoft 365 and on-premises performance
With recent moves globally to remote working, combined with accelerated usage of products like Microsoft Teams, organizations face a major problem understanding what the real user experience is.
In a carefully controlled on-premises environment, where quality of service controls can be applied at the network layer, statistics collected from PC desktops and desk phones, network switches, and servers, it is possible to gain a good amount of insight into underlying technical issues that might affect users before they raise a service desk ticket.
A move to cloud services, like Microsoft 365, has gradually reduced visibility into the end-to-end path between a person and the service itself. In an office setting, visibility into where users are and potential network congestion can highlight potential issues, as can visibility into performance through Microsoft’s reporting tools, such as the service health dashboard and service-level reporting.
What is difficult to gauge is what the experience is like from user locations to Microsoft 365 across all services they access, or to understand not only whether there is a fault within the service, but how it affects actions like posting a message to Microsoft Teams, uploading files to OneDrive or sending email messages both in Exchange Online or to recipients in a hybrid installation.
GSX Gizmo aims to fill this large gap in visibility. In the latest updates, advanced visibility into Microsoft Teams performance is added, and in this review, we’ll take a look at these features.
GSX Gizmo use cases
GSX Gizmo is designed primarily for enterprise customers looking to gain visibility into complex global deployments, though any IT team looking to be more proactive may benefit from the functionality it offers.
Challenges GSX Gizmo aims to meet include:
- Insights into Teams performance across multiple locations.
- Providing visibility of per-site performance, including latency and bandwidth when uploading, downloading, and accessing files on OneDrive and SharePoint.
- Providing visibility into the performance of Microsoft 365 for key employees by deploying agents to their machines.
- Providing near-real-time reporting on mail flow both within Exchange Online, multi-geo regions, and hybrid deployments with mailboxes on-premises and in the cloud.
- Reporting on the health of supporting components for your Microsoft 365 deployment, such as Azure AD Connect, AD FS, and collecting and logging information on service-by-service health.
- Providing dashboard views for service desk teams or IT executives to provide an overview of the current and historical user experience.
- Providing automated alerting to service issues, from availability, latency, per-site packet loss, call failures in Teams, or health issues with Exchange Servers.
- Collecting data for use in reporting services, in particular, Power BI for viewing using built-in reports with the ability to reuse or interrogate the data.
We’ll walk through the basics of the installation, and then examine the relevant functionality to assess if GSX Gizmo can meet use cases like those above.
Installation and configuration
Last time we reviewed GSX Gizmo three years ago, the majority of the functionality was accessed using the GSX Monitor product installed on Windows Server. The setup and installation of the product were straightforward and mostly self-contained, but it reflected the typical needs of enterprise customers at the time who were beginning their journey to Exchange Online. The GSX Gizmo component was a more recent addition to the product.
The process to setup and install GSX Gizmo as a product has not vastly changed – it can be installed on a single Windows Server or you can use a cloud-based service from GSX. The product relies upon SQL Service and RabbitMQ, along with prerequisites for .NET and IIS.
Like many enterprise products, the installation and configuration process is typically performed with the assistance of GSX. To begin the process, we discussed the typical process with GSX team members who explained that typically an installation includes a hand-holding process through the setup and installation, a customized configuration suitable for the organization, assistance configuring the relevant components and deploying reporting agents, known as “robots” by GSX.
To gain some insight into the product underpinnings, we elected to complete the implementation without hands-on assistance from GSX, allowing us to understand the architecture of the product and to provide an opportunity to use their support – which we’ll discuss later in the review.
The platform is now what most IT professionals would class as enterprise-ready. It relies on a set of central services that do not require interactive console access to the server for day-to-day administration tasks of viewing of reporting data. For the purposes of the review, we used a SQL Express database platform, however for a full deployment, GSX expects customers to utilize a full version of SQL Server.
Connection to database backends and the RabbitMQ instance is handled cleanly by the installation tool. To aid with the straightforward deployment of GSX’s robots, the installation automatically packages the robot installation packages with a pre-configured MSI and transform file with connection details for reporting back to the GSX Gizmo server.
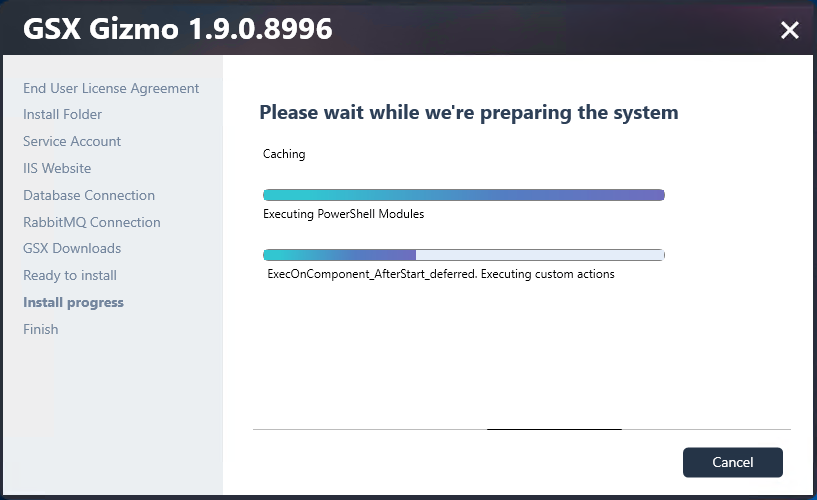
After installation, further configuration, such as licensing and monitoring configuration, is performed using PowerShell. GSX provides a dedicated module and management shell used to configure service-specific attributes, such as on-premises Exchange Server URLs. Microsoft 365 endpoints, such as for Teams, OneDrive, or Exchange Online, is built-in and requires little configuration.

After enablement of various templates for monitoring, additional configuration can be performed within the GSX Gizmo web interface.
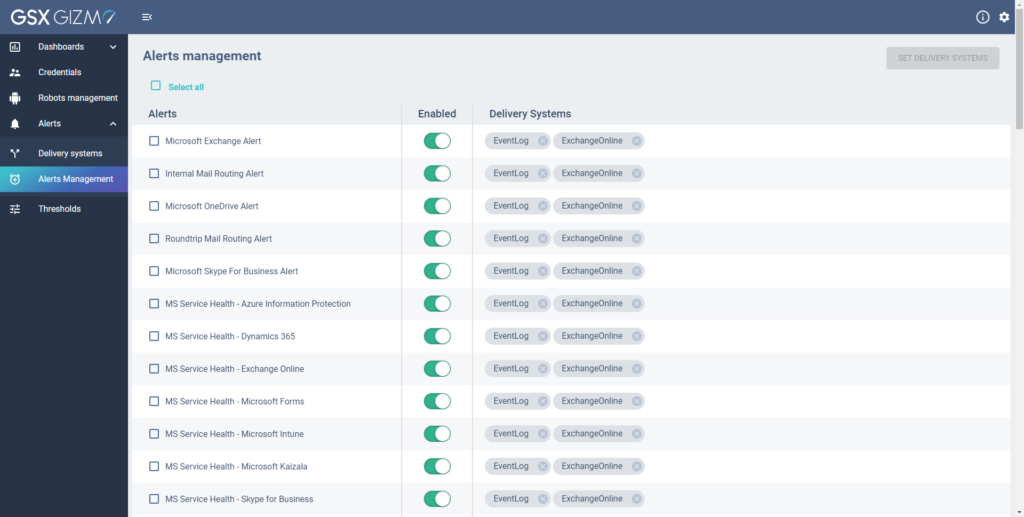
The web interface provides access to dashboards, credential management for performing synthetic transactions and accessing on-premises server data, management of robots, configuration of alerts and thresholds, and portal security.
To complete a basic installation, it is necessary to configure credentials for robots to use, set up alerting, and to configure the security for access to the web UI.
By design, GSX Gizmo has no credentials configured and does not have security configured via built-in IIS functionality.
GSX has chosen to adopt a modern method for configuring the security of the GSX Gizmo web UI, and use Azure AD for sign-in. As part of a complete setup process, a customer will work with GSX to register their GSX Gizmo installation as an application in Azure AD within the customer’s environment.
The view from GSX is that this approach provides a better security model to traditional IIS-based authentication, as a customer can then utilize all capabilities within Azure AD to secure access, such as only allowing access to users based on security group within the service, and by application of Conditional Access Policies. This means, for example, that if you expose GSX Gizmo externally, you can rapidly ensure that only compliant devices, those from certain IP addresses or those that satisfy multifactor authentication can access the service, and restrict access to only designated IT support employees.
This is an excellent approach, and whilst this offloads responsibility for access management to Microsoft — and your controls — is the right approach for an application designed primarily for monitoring Microsoft 365.
Further security controls GSX recommends for an implementation include ensuring the security of supporting components such as RabbitMQ.
Deployment of the robot software is straightforward. You must make the HTTPS interface and RabbitMQ instances available from all locations the Windows machines running the robots are. In our environment, we deployed internal robots and a robot based overseas connecting to the GSX Gizmo instance over the internet, to give us visibility into the reporting capabilities for both LAN-based reporting and reporting from remote sites or even remote worker’s PCs.
While the software can be deployed to end-user devices, GSX suggests this it is not typical to deploy the agent to all PCs. A typical approach may be to deploy to VMs at offices around your environment, and in the case of remote workers, potentially deploying to a smaller number of key workers who are based outside the office for additional insights.
Overall functionality
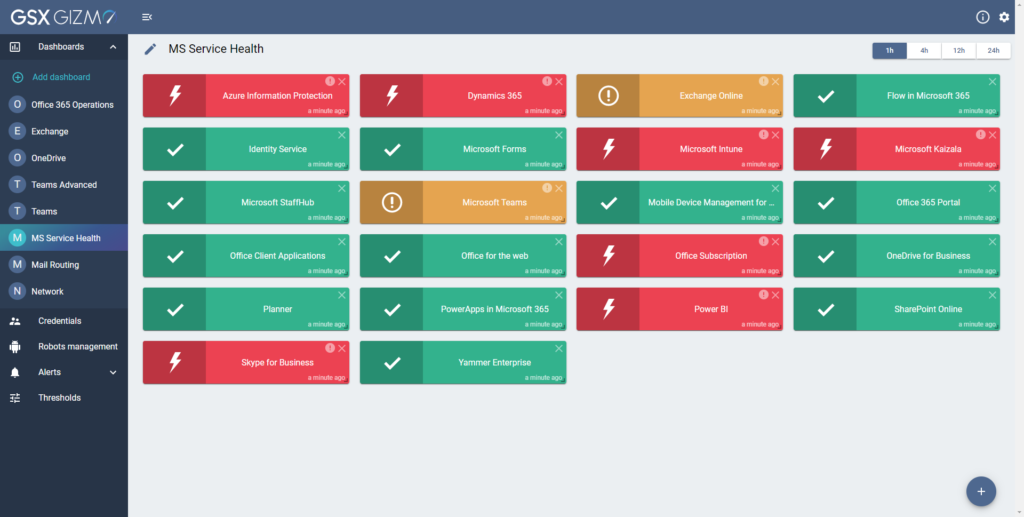
Within the GSX Gizmo UI, dashboards provide information about aspects monitored by the product. These dashboards range from the example below, providing a red/amber/green view of Microsoft 365 Service Health, to deeper near-real-time statistics across Microsoft 365 and individual services:
Information shown in dashboards such as the Teams Advanced view is immediately useful, providing a quick overview of whether the service is performing as expected and a graph showing overall performance based on data collected from all robots.
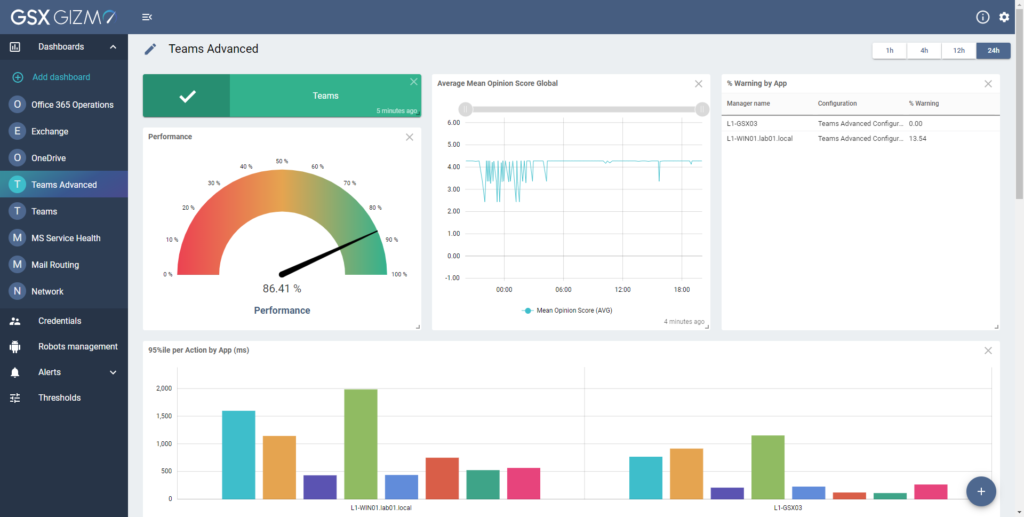
This provides further drill-down and graphs showing the results of synthetic transactions, such as the graph shown below giving a graph-based view of the average time it takes to perform actions like post messages to channels, search for users, upload and download files and send instant messages:

Similarly detailed information is shown across other services monitored. For example, the dashboard for OneDrive provides clear information showing similar statistics.
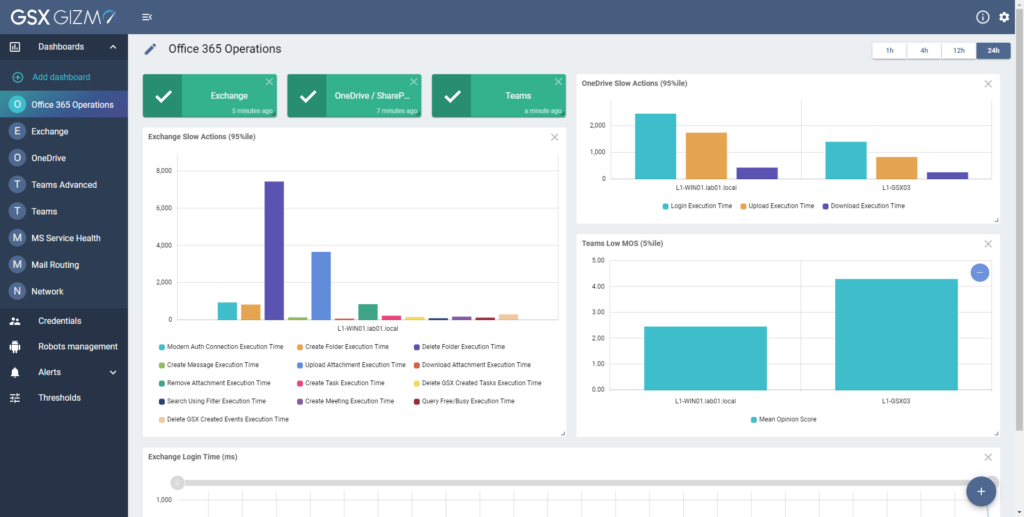
One of the most insightful dashboards included is the Office 365 Operations dashboard, which provides a collated view of Exchange, OneDrive, SharePoint, and Teams within one place, allowing IT admins to understand quickly whether there is a problem with a particular service, problems with access from a particular location, or a wider issue:
In addition to the built-in dashboards, GSX provides the ability to create curated dashboards. These appear well-suited to IT teams looking to customize a view for screens within operations centers and similar tasks.
Access to a deeper level of data within GSX Gizmo, and the ability to share the data more widely, comes from GSX Gizmo’s Power BI data integration.
Whilst Power BI is not essential for using the product — it provides the analytics functionality with more customization available of the data viewed. GSX also use Power BI to provide the ability to map out data collected, which is particularly useful for organizations with regional or global sites.

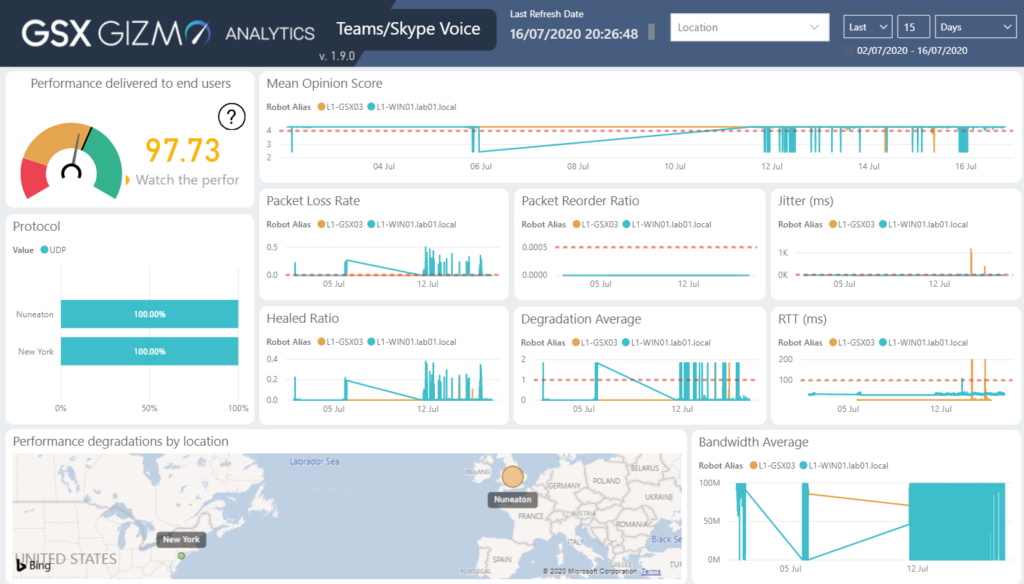
Built-in pages within the Power BI reports include a top-level dashboard, with drill-down dashboards into Exchange, OneDrive, and Teams. These reports provide information to summarize the use-experience. In the example below, the Teams report provides crucial information, including data about the performance delivered to end-users and information showing statistics such as packet loss, jitter, and bandwidth available:

As well as technical reports — and the ability to download data collected, GSX also provides reporting on what the user experience is likely to have been for users in particular locations. In the example below, the report demonstrates the number of negative experiences users are likely to have had with Exchange, SharePoint, and Teams Voice, along with details regarding the location these occurred in, and the particular degraded actions:

Within the reports, GSX remains true to its roots for monitoring email platforms as well. One of the key areas organizations would traditionally monitor (and was much the focus in the last review) was performance in the real-world of email. Reporting is available to drill down into routing time, mail hops and allows selection by location, and for examination of hybrid or pure Exchange online/on-premises scenarios.
Finally, another useful capability the Power BI reports provides is the ability to combine logged data together within the interface. For example, if you are investigating issues with calling and looking to examine packet loss, latency, and jitter, the cross-analysis provides capabilities to examine this quickly. This can then be quickly compared against OneDrive and Exchange — something not easy to do using Microsoft’s own Teams call quality dashboard offerings:

GSX Gizmo pricing and support
GSX Gizmo is based on a subscription model and offers a free trial. Options include a cloud-based offering and on-premises installation, and both are supported by GSX. In addition to the software, GSX provides services to assist with installation, configuration, and ongoing customer success. We would recommend using these services from GSX.
Support provided throughout the review process was excellent. Whilst we expect GSX to provide good support in a review, the majority of answers to questions were rapidly answered, and either documentation for the scenario or links to the relevant knowledge base article was provided quickly. Answers to technical questions regarding securing the product effectively or configuring it for particular use-cases were answered directly by the GSX support contacts indicating these are areas that GSX has already considered.
The verdict
GSX Gizmo provides a level of depth not found within the Microsoft 365 platform itself, and although Microsoft improves the level of reporting available, these improvements, such as the ability to investigate client performance after a Teams meeting or call ends, are useful when trying to troubleshoot reported issues — but they do not provide the full level of insight from clients to the service across core Microsoft 365 services in one place, nor are consistent.
Since our previous review GSX Gizmo, both the interface and the depth of reporting have significantly improved. Particularly for large enterprises with global workforces, GSX Gizmo is a must — and will provide value to almost every organization supporting Microsoft 365. In our TechGenix rating system that ranges from zero to five stars, GSX Gizmo receives five stars, which is a gold star review.

Rating 5/5