If you would like to read the other parts in this article series please go to:
Disable POP/IMAP
There will probably be some services for which monitoring should be disabled, such as IMAP4 and POP3. Disabling monitoring for these services in previous versions of the Exchange MP was quite easy. All it took was to disable the rule that generated the alert.
For the Exchange Server 2010 MP the story is a little bit different because of the new correlation engine. You should never disable the rules that generate alerts, instead the correct way of disabling monitoring for some services is to disable the monitors associated with each service.
Also you must target the override at the Root Management Server (RMS) class, since it’s where the correlation engine lives and generates the corresponding alerts.
In order to find out which monitor should be disabled, run the Health Explorer for the desired service and expand it until you find the KHI monitor in critical state. Figure 34 shows an example for the IMAP4 service.
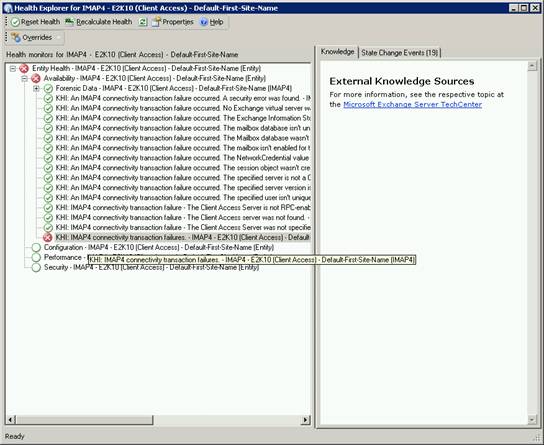
Figure 34: Health Explorer for IMAP4
To disable POP3 monitoring, if the service is not being used, follow these instructions:
-
Go to the Monitors node located under Management Pack Objects, in the Authoring section of the Operations Console. In the Look for field, type POP3 and click Find Now. Right-click the KHI: POP3 connectivity transaction failures and select Overrides | Override the Monitor | For a specific object of class: POP3 (Figure 35).
-
In the Select Object window select the server where you want to disable POP3 monitoring and click OK (Figure 36).
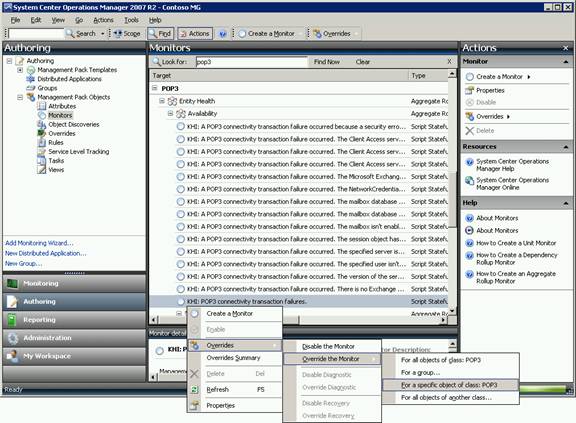
Figure 35: Override the POP3 monitor

Figure 36: Select Object
-
In the Override Properties dialog box, select the Enabled parameter name and select an override value of False. Select a destination management pack and click OK (Figure 37).

Figure 37: Override Properties
Common Troubleshooting
There are some common problems you may get right after you import and start using the Exchange 2010 MP. I’ll enumerate a few and tell you the resolution.
1. Some Client Access test cmdlets failed to run
The cause of this alert is probably because the new-TestCasConnectivityUser.ps1 hasn’t been run to initialize the test mailbox.

Figure 38: Some Client Access test cmdlets failed to run
2. TCP Connectivity Against Local Server – RPC Client Access failure
In my test lab, where I was using Exchange Server 2010 SP1 + RU2, I started getting the alert TCP Connectivity Against Local Server – RPC Client Access failure (Figure 39). By analyzing the Event Log of the Exchange Server I noticed the event ID 38 (Figure 40), when the Test-ECPConnectivity cmdlet is being run in order to test the Exchange Control Panel.
This is actually a known issue and is supposed to be fixed by Rollup Update 3 for Exchange Server 2010 SP1. At the time of this writing, RU3 has been retired, to compatibility issues with Blackberry Enterprise Server. Please check the following article Exchange 2010 SP1 Rollup 3 and BlackBerrys sending duplicate messages.
As a workaround you can disable the monitor KHI: Exchange Control Panel connectivity (External) transaction failures targeted at ECP, as explained in this blog post Exchange 2010 SP1: a known issue, a canary and flip flopping…

Figure 39: TCP Connectivity Against Local Server – RPC Client Access failure

Figure 40: Event Properties
3. There are no Exchange 2010 alerts
This problem can occur if the Microsoft Exchange Monitoring Correlation service is not running. Fortunately there is one alert specific for that, as depicted on Figure 41.
The solution is simple, go to the Services management console and start the MSExchangeMonitoringCorrelation service.
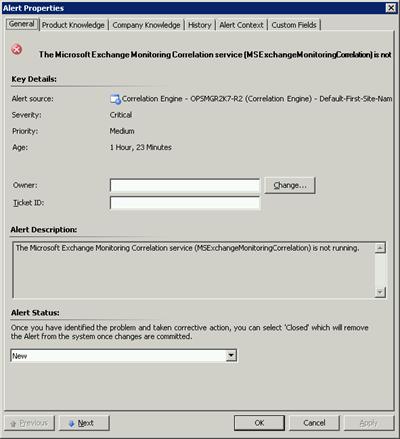
Figure 41: Correlation service alert
4. Exchange 2010 MP may cause config churn
There are two discoveries in the Exchange 2010 MP. Version I used (14.0.650.7) that may cause some significant config churn. The two discoveries target the “Exchange 2010 Mailbox” class and are:
-
Microsoft.Exchange.2010.Mailbox.MdbOwningServerLocalEntityDiscoveryRule
-
Microsoft.Exchange.2010.Mailbox.MdbOwningServerRemoteEntityDiscoveryRule
By default, these discoveries run every 14400 seconds (4 hours). Since they collect some properties that change with every run of the discovery they may cause the mentioned config churn.
This problem should be resolved in a future MP, which will support Exchange 2010 SP1. Meanwhile, as a workaround, you may consider overriding these to run once per day (that is the maximum supported for this particular discovery). Please be aware this will not solve the config churn, it will simply reduce the amount caused by this specific workflow (Figure 42).
For more information and instructions to configure the necessary overrides please refer to the following blog post: Config Churn & Exchange 2010 MP.
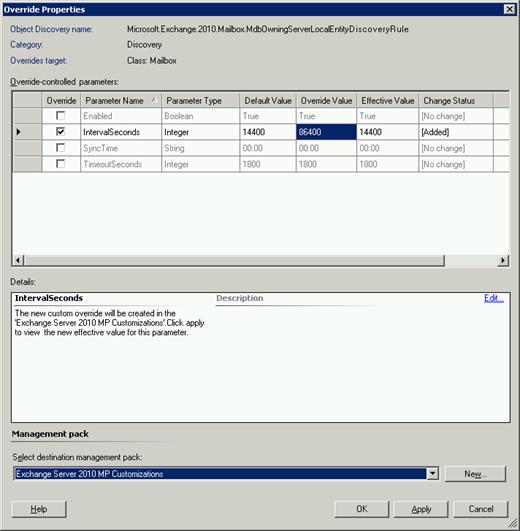
Figure 42: Override Properties
5. Exchange 2010 Reports: Cannot resolve the collation conflict between “SQL_Latin1_CP1_CI_AS” and “Latin1_General_CI_AI” in the equal operation
You may get the error “Cannot resolve the collation conflict between “SQL_Latin1_CP1_CI_AS” and “Latin1_General_CI_AI” in the equal operation” when trying to visualize some Exchange 2010 reports (Figure 43).

Figure 43: An error has occurred during report processing
The reason is that SQL collation “SQL_Latin1_General_CP1_CI_AS” needs to be designated for installing the Operations Manager Database, as explained at the TechNet page Operations Manager 2007 R2 Supported Configurations.
There is no workaround, you’ll need to migrate the OpsMgr DB to a properly installed SQL Server. More information at the following Knowledge Base article: KB 958979 – SQL collation “SQL_Latin1_General_CP1_CI_AS” needs to be designated for installing OpsMgr DB.
Reports
The following reports are included in the Microsoft Exchange Server 2010 Management Pack.:
|
Report |
Description |
|
Service Availability |
Models availability for clients that access their mailboxes through Microsoft Office Outlook and Outlook Web App. It also models mailbox database availability. |
|
Client Access Availability |
Models the availability of each client access protocol running on a Client Access server. For each, it models availability at the server, site, and datacenter (management group) level. |
|
Unified Messaging Availability |
Models the availability of the Local Voice Unified Messaging task. |
|
SMTP (Client Submission) Availability |
Models client SMTP submission availability as measured by synthetic transactions. |
|
Outlook Client Performance |
Models client performance statistics based on the performance data submitted to Exchange by Outlook. |
|
Hourly Mailflow Statistics |
Models statistics from message tracking logs to provide information on mail flow latency by hour. |
|
Daily Mailflow Statistics |
Models statistics from message tracking logs to provide information on mail flow latency by day. |
|
Distribution Group Usage |
Models usage of distribution groups. |
|
Top Users |
Models usage data for clients with the most messages sent, received, and failed. |
Table 1
-
To run a report, click the Reporting button in the Operations Console, expand Reporting and then click Microsoft Exchange Server 2010 Report Library (Figure 44).
-
Double-click the report you want to run. In the Objects area, click Add object.
-
Click Search to see a list of the available objects for the report. Select the object you want to add and then click Add.
-
Use the settings on the page to further customize the report, and then click Run. Figure 45 depicts the Microsoft.Exchange.2010.Reports.Transport.Platform.TopUsers.

Figure 44: Exchange Server 2007 Reports

Figure 45: Exchange 2010 Top Users Report
Summary
For the last four parts of this article we covered the whole installation and configuration process of the Exchange Server 2010 Management Pack. If there are still any doubts this MP introduces many improvements regarding the effort it takes to perform such a task, let us just say that for the previous Exchange 2007 MP it took me 6 parts to describe the same process.
The next version of the Exchange 2010 MP will be designed to support Service Pack 1 of Exchange 2010 and it’s expected to ship very soon. Let’s wait to see the new improvements and if it corrects some of the known issues (bugs) discussed in this article.
Related Links:
If you would like to read the other parts in this article series please go to: