If you would like to read the other parts in this article series please go to:
Service Level Tracking
Now that we covered the detailed monitoring of an Exchange Server 2010 infrastructure, I’d like to expand this article to a higher level of the operations and management framework: service level tracking.
Whether an organization is providing messaging and collaboration services to external customers, or it’s just the internal IT Department servicing the “internal customer”, the government of the general availability of the service is often regulated by service level agreements (SLAs).
And with the need to control those SLAs in mind, Microsoft released the Service Level Dashboard for System Center Operations Manager 2007 R2. This Solution Accelerator addresses the need that managers, application owners, and IT professionals have to make sure that their resources are available and performing at acceptable levels.
Service Level Dashboard 2.0
The Service Level Dashboard is an application that is built in Windows SharePoint Services 3.0. The dashboard is designed to work with an existing Operations Manager 2007 R2 infrastructure that is configured to monitor business-critical applications. The dashboard evaluates an application or group over a period that the administrator selects during setup, determines whether the defined service level commitment was met, and displays summarized data about the service levels.
In Operations Manager 2007 R2, you define your service goals (also referred as “service level objectives” or SLOs), then the Service Level Dashboard evaluates each SLO over the defined time period and determines if the goals are met during that period and for how long. The dashboard displays each SLO and identifies its states, based on defined service level targets.
The following diagram illustrates, at a high-level, the process flow that occurs within the Service Level Dashboard environment:

Figure 46: Service Level Dashboard Process Flow
Define Service Level Objectives (SLO)
The first step required to define SLO is to create a distributed application for the Exchange 2010 service:
- Log on with administrator’s credentials to the System Center Operations Manager 2007 R2 machine and open the System Center Operations Manager Console. In the System Center Operations Manager Console, click Authoring. Right click Distributed Applications, and then click Create a new distributed application.
- In the Name box, type “Exchange 2010 Service”. In the Description box, you can type a description. Under Template, select the Messaging template. In the Management Pack drop-down box, choose the Exchange Server 2010 MP Customizations management pack (Figure 47). Click OK.
- Click Save and close the window that opens (Figure 48).
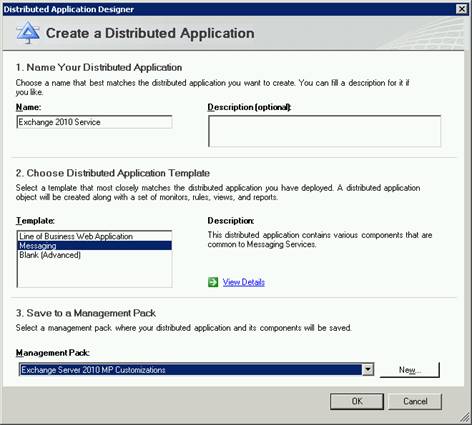
Figure 47: Create a Distributed Application
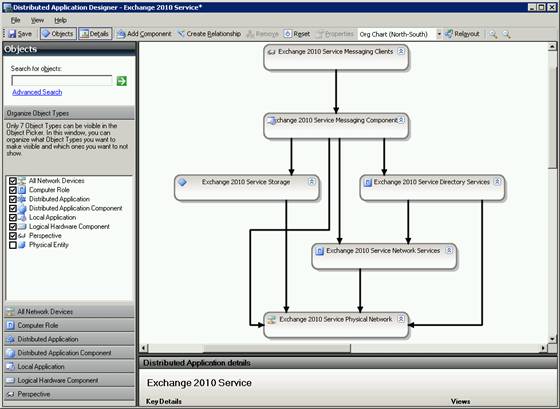
Figure 48: Distributed Application Designer
Now that we have our distributed application defined, it’s time to create the Service Level Objective. The new Service Level Tracking feature in Operations Manager 2007 R2 offers the capability to define SLOs that you can then use to track the health of an application or group. You can define an SLO for an application, a group, or other class of objects. These SLOs focus on such targets as availability and performance.
To define an SLO for the “Exchange 2010 Service” distributed application previously created:
- In the Operations console, from the Authoring view, click Management Pack Objects and then, in the Authoring navigation tree, click Service Level Tracking. In the Actions pane, click Create.
- In the Name box, type the name of the application or group. You can optionally provide a description. Click Next.
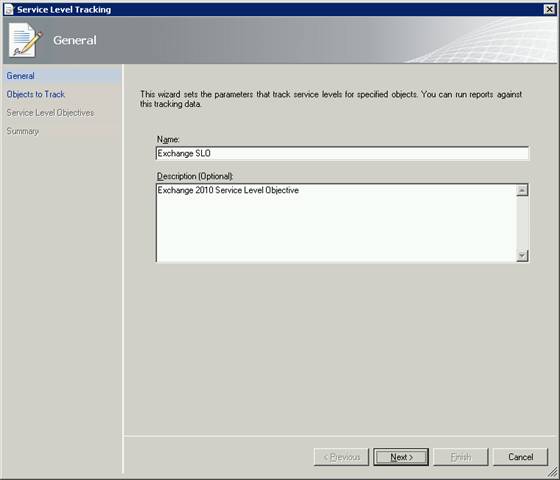
Figure 49: Create a Distributed Application
- In the Objects to Track window (Figure 50), under Targeted class, click Select to specify the class for the service level. In the Select a Target Class window (Figure 51), select Exchange and click OK.

Figure 50: Objects to Track
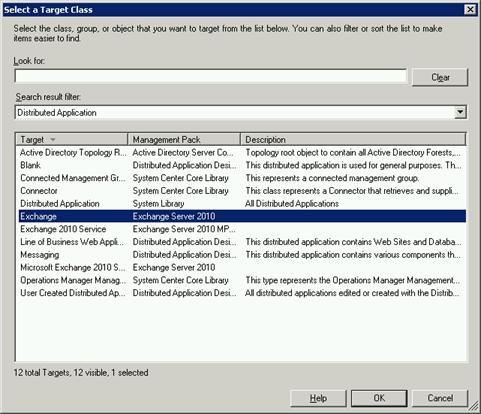
Figure 51: Select a Target Class
- Select the management pack where this service level will be saved (Exchange Server 2010 MP customizations) and click Next.
- On the Service Level Objectives page (Figure 52), click Add and then click Monitor state SLO to create a new monitor to track the availability of the application or group. Define the state monitor as follows:
a) In the Name box, type Availability SLO
b) In the Monitor drop-down box, select Availability.
c) For Service level objective goal, provide the numerical measure for your objective. For example, if your goal is 99.5 percent availability, type 99.500.
d) To refine what the monitor tracks as available, select or clear any of the following state criteria to be counted as downtime:
– Unplanned maintenance
– Unmonitored
– Monitoring unavailable
– Monitor disabled
– Planned maintenance
– Warning
e) Click OK.

Figure 52: Service Level Objective (Monitor state)
- Click Add and select the Collection Rule SLO. In the Service level objective name box, type Performance SLO (Figure 53).
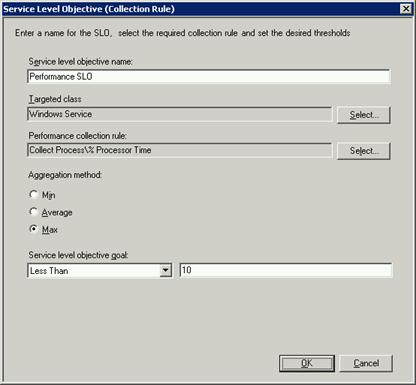
Figure 53: Service Level Objective (Collection Rule)
- Next to the Targeted class box, click the Select button and select Windows Service (select the second option), as depicted in Figure 54. Click OK.

Figure 54: Select a Target Class
- Next to the Performance collection rule box, click the Select button and select Collect Process\% Processor Time (Figure 55). Click OK.
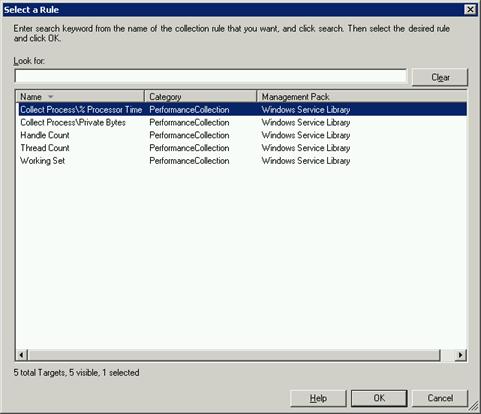
Figure 55: Select a Rule
- Under Aggregation method, select Max. In the Service level objective goal drop-down, select Less than, and type 10 in the text box. Click OK, then click Next (Figure 56), and then click Finish (Figure 57). Click Close to close the window when you have successfully created the SLO.
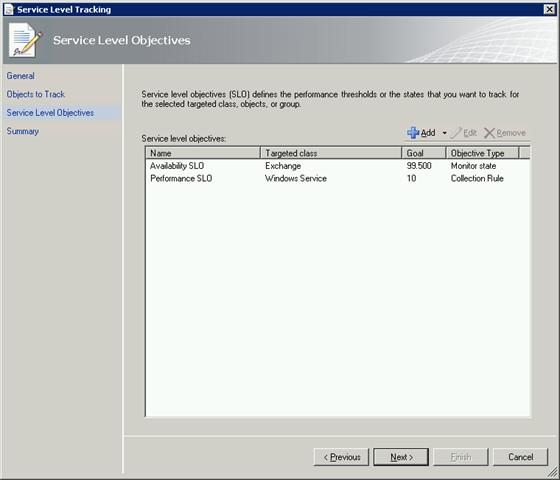
Figure 56: Service Level Tracking – Service Level Objectives
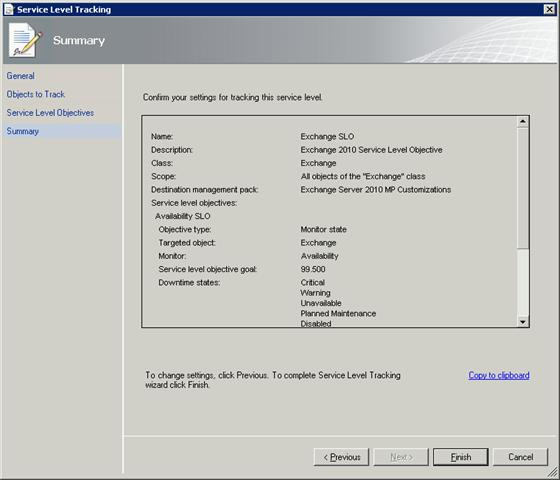
Figure 57: Service Level Tracking – Summary
The Service Level Tracking Summary Report compares the results for one or more service levels to the defined target objectives. From this report, you can examine a more detailed report, the State view, or the Service Level Agreement view.
- In the Reporting view of the Operations console, click Microsoft Service Level Report Library. Right-click the Service Level Tracking Summary Report, and then click Open.
- Click Add. In the Type Name box, type “Exchange SLO” and then click Search. Under Available Items, select the “Exchange SLO” and then click Add. Click OK to close the Add Service Levels window (Figure 58).
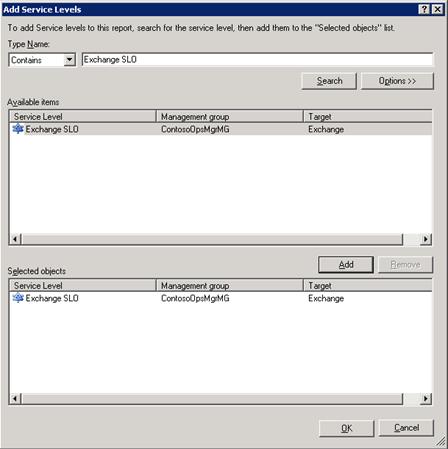
Figure 58: Add Service Levels
- In the Data Aggregation drop-down box, select Hourly. Select an appropriate time interval, using the From and To dropdown boxes. Click Run to generate the report, as depicted in Figure 59.
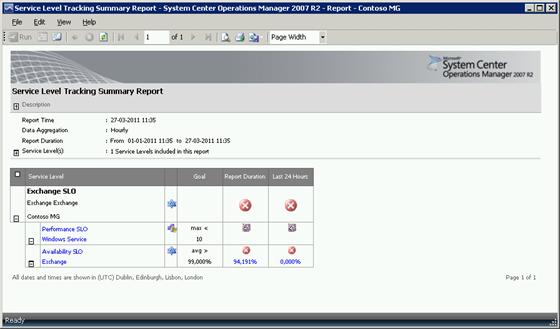
Figure 59: Service Level Tracking Summary Report
Install the Service Level Dashboard
After configuring Operations Manager 2007 R2 with the SLOs required for tracking, we can now install the Service Level Dashboard (SLD). Service Level Dashboard 2.0 integrates with an already functioning deployment of Operations Manager 2007 R2 and has the following software requirements:
-
Operations Manager 2007 R2 with Reporting and Data Warehouse
-
Windows SharePoint Services 3.0 SP1 or higher (Microsoft Office SharePoint Server 2007 SP1 is also supported).
-
SQL Server 2005 SP2 or SQL Server 2008.
Note: Typically, WSS and MOSS installations install SQL Server Embedded Edition, which does not meet the Service Level Dashboard requirement to create SLD content database. -
Microsoft .NET Framework 3.5
Since I decided to install Service Level Dashboard on my Operations Manager machine, the only requirement I missed was the SharePoint Services, so I downloaded and installed Windows SharePoint Services 3.0 x64 with Service Pack 2. After installing WSS, follow these procedures to install the Service Level Dashboard 2.0:
- Download the Service Level Dashboard 2.0 for System Center Operations Manager 2007 R2 to your computer. The Service Level Dashboard 2.0.zip contains the following files:
- SLD 2.0 Release Notes.rtf
- Microsoft.EnterpriseServiceMonitoring.ServiceLevelDashboard.R2.mp
- Service Level Dashboard 2.0_x86.msi
- Service Level Dashboard 2.0_x64.msi
- Service Level Dashboard 2.0 for Operations Manager 2007 R2 User Guide.docx
- Supplemental License for Service Level Dashboard for OpsMgr 2007 R2.rtf
- Extract the .zip file and copy the Management Pack from the location you specified during download to the Operations Manager management server. This management pack is essential to update the stored procedures required for SLD functionality.
- To import the SLD MP, open the OpsMgr 2007 Operations Console. Click the Administration tab, right-click the Management Packs node and then click Import Management Packs. Click Add, Add from disk and then click No on the Online Catalog Connection window. Browse to the folder where you extracted the .zip file and select the Microsoft.EnterpriseServiceMonitoring.ServiceLevelDashboard.R2.mp file (Figure 60). Click Open and then click the Install button (Figure 61).

Figure 60: Select Management Packs to import

Figure 61: Select Management Packs
- After the import process is complete and the dialog box displays an icon next to the management pack indicating success or failure of the importation (Figure 62), click Close.
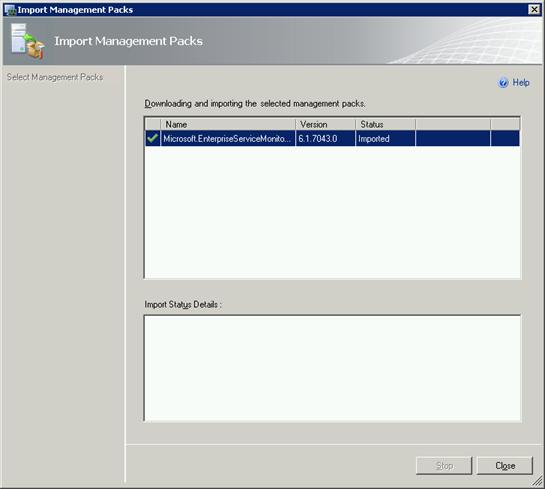
Figure 62: Import Management Packs
- Copy the ServiceLevelDashboardV2_x86.msi or ServiceLevelDashboardV2_x64.msi (whichever one is appropriate for your system) file from the location you specified during download to a Windows SharePoint Server that has SharePoint 3.0 Central Administration installed. Run the .msi file to begin the installation process.
- In the Welcome window (Figure 63) click Next. Accept the EULA (Figure 64) and click Next.

Figure 63: SLD Setup Welcome screen

Figure 64: SLD Setup EULA
- In the Windows SharePoint Services 3.0 Information window (Figure 65) provide the necessary information and click Next.
Note:
Neither the SQL Server Embedded Edition installed by WSS, nor the Windows Internal Database (MSSQL$MICROSOFT##SSEE) meet the Service Level Dashboard requirement to create SLD content database. Therefore we must specify a SQL Server 2005 SP2 or SQL Server 2008 instance on the SharePoint Database Server Name (I used the same of the Operations Managers server).

Figure 65: Windows SharePoint Services 3.0 Information window
- The next window alerts you to install the Service Level Dashboard for Operations Manager 2007 R2 MP. Since we have already done it, click Next (Figure 66). Click Install (Figure 67) and then click Finish.

Figure 66: Operations Manager 2007 R2 Information

Figure 67: Ready to Install Service Level Dashboard 2.0
- After finishing the SLD installation, if you open the Internet Information Services Manager, notice there is now a SharePoint site running on port 51918 (Figure 68).

Figure 68: SharePoint – 51918
To select service levels and set default values in the Service Level Dashboard:
- Open the newly created site using Internet Explorer (http://opsmgr2k7-r2:51918), click the Site Actions menu, and click Edit Page (Figure 69).
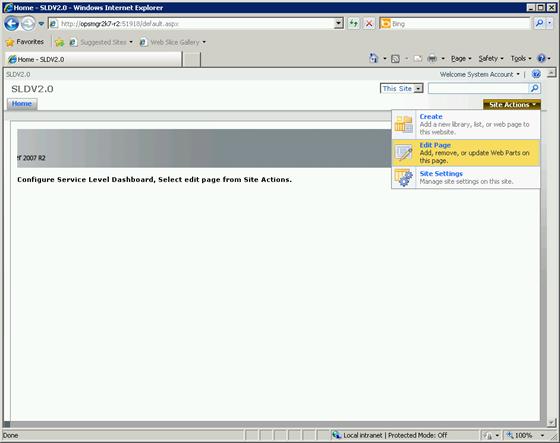
Figure 69: Configure Service Level Dashboard
- In the Dashboard Configuration Web Part:
a. From the list of Service Levels, select a service level. You can only select a maximum of six Service Levels per dashboard. For our case we’ll use “Exchange SLO”.
b. For Dashboard Refresh Rate, Specify the value from 0 to 1440 (minutes). The value 0 indicates no refresh. It is recommended that you choose 30 Minutes for the Dashboard Refresh Rate if you choose more than 24 hours for Dashboard Default View.
c. For Dashboard Default View, choose a default view from the drop-down list.
d. For Aggregation Type, choose Hourly or Daily from the drop-down list. It is recommended that you choose Daily for the Aggregation Type if you choose more than 24 hours for Dashboard Default View. Click Apply Filter to save the settings and then Exit Edit Mode form the upper-right corner.

Figure 70: SLD Web Part
- When you check the Service Level Dashboard, you can see dashboards for different service levels by clicking each service level’s name (Figure 71).

Figure 71: Service Level Dashboard
Since this is a test environment, it was with no surprise that the Service Level Dashboard showed a red condition, meaning the SLOs are not being met.
Conclusion
To meet compliance needs, administrators require a solution for tracking, managing, and reporting the Exchange Server 2010 messaging infrastructure. Administrators need tools to observe conditions in real time and send alerts regarding monitoring the status of messaging services, taking remedial actions to minimize incidents and events, and providing trend data for optimizing messaging service performance.
The Service Level Dashboard is an application designed to work with an existing Operations Manager 2007 R2 infrastructure that is configured to monitor business-critical applications, such as Exchange Server 2010. The dashboard evaluates an application or group over a period that the administrator selects during setup, determines whether the defined service level commitment was met, and displays summarized data about the service levels.
Related Links:
- Service Level Dashboard 2.0 for System Center Operations Manager 2007 R2
- Service Level Dashboard for System Center Operations Manager 2007 ¨C Version 2.0 Overview
- Windows SharePoint Services 3.0 x64 with Service Pack 2
If you would like to read the other parts in this article series please go to: