I’m sure a lot of cloud administrators had their euphoria moment when moving/provisioning their first virtual machines as part of their hybrid environments. The benefits and elasticity of Microsoft Azure makes sure you don’t miss a thing about your old traditional datacenter environment. In the IaaS (infrastructure-as-a-service) vs. on-premises debate, the changes don’t change that much from the management perspective. At the end of the day, we are used to managing VMs running on our hypervisors. In Azure, it is similar through a portal but with virtually unlimited room to grow the complexity and resources of the environment. The network area is not that clear when compared with IaaS vs. VMs for a traditional network administrator. For starters, everything is SDN (software-defined network.) The cloud administrator needs to get acquainted with how the network works in Azure and getting to know Network Watcher will help a lot during troubleshooting. In this first of two articles, we will show you how to get started with Network Watcher and show you some tools you can use to make that easier.
Getting started with Network Watcher
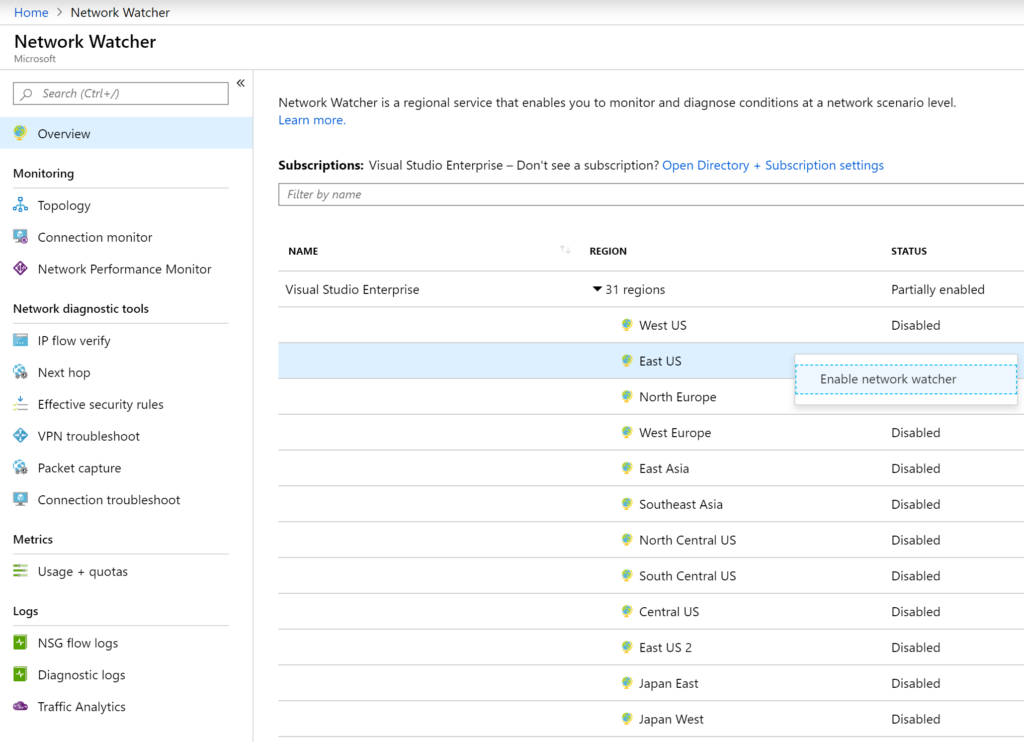
Network Watcher is free and does not require a provisioning process. We just need to enable the regions that we want to monitor. To start using it, type Network Watcher on the search area of the Azure Portal. In the Overview blade, right-click on the regions where you want the service to be enabled and click on Enable network watcher. That’s it! After that, we can start exploring the several tools available on the platform.
The feature is comprised of three main areas: monitoring, network diagnostics tools, and logs.
Monitoring section
This area is comprised of three items: topology, connection monitor, and network performance monitor (NPM). Some of the blades that we can see within Network Watcher are shared with other network components throughout the Azure Portal.
For instance, the topology blade allows the cloud administrator to select a subscription, then a resource group within that subscription, and finally a specific virtual network. The result will be a graphical representation of the virtual network, including virtual machines, network interfaces, and even NSG (Network Security Groups).
If you need to use the diagram, you can always click on download topology and a .svg file will be available to download.

The second blade in the monitoring section is the connection monitor. This is a key component. We can monitor to endpoints and they can be an existing virtual machine in Azure or a specific IP/name. To create our first connection monitor, click on Add and then specify the VM that will be the source and define the target. We can configure which port will be monitored and how often we want the probe to run. When complete, click on Add.
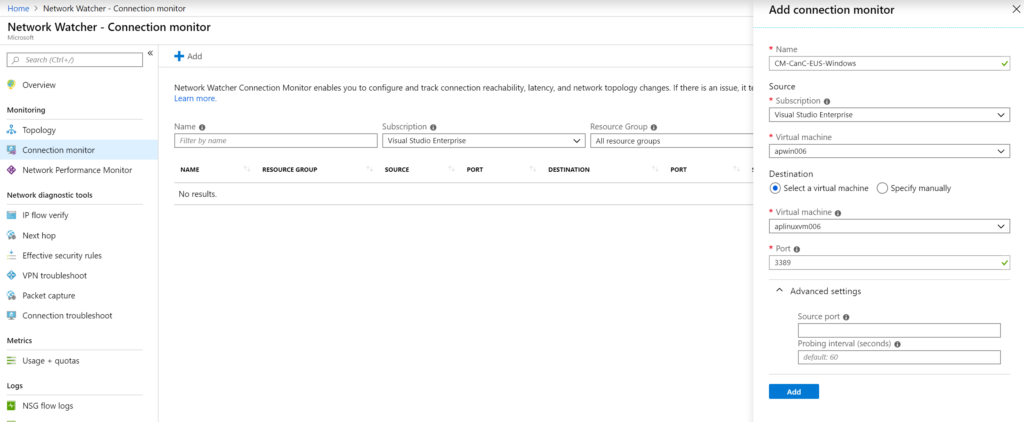
Wait a little bit, and we will have metrics about the connection, and we can view the historical data in a grid or graphical format, as depicted in the image below.
- When selecting a VM as a source in the wizard, all the target VMs listed will be part of the same virtual network. To overcome this limitation, we can always specify the IP address instead of selecting an existing VM in the wizard.
- When a VM is selected as source, the AzureNetworkWatcherExtension will be automatically added to the given Virtual Machine.
- All the connection monitors are displayed in the Azure Monitor / Alerts area. Thus notification can be created based on the number being generated by the connection monitor.
The Network Performance Monitor (NPM) uses Log Analytics and provides a solution to help the administrator understand the network. This single piece requires an article on its own, and that is the reason that we are going to mention it here. (Stay tuned for that article!)
The feature requires Log Analytics in a specific set of regions. At the time of this writing (nine regions), it needs Log Analytics agents installed on at least one VM resource on each subnet to be able to monitor appropriately. The solution allows monitoring of other services such as Office 365, Dynamics, and even Express Route.
Exploring the networking diagnostic tool area
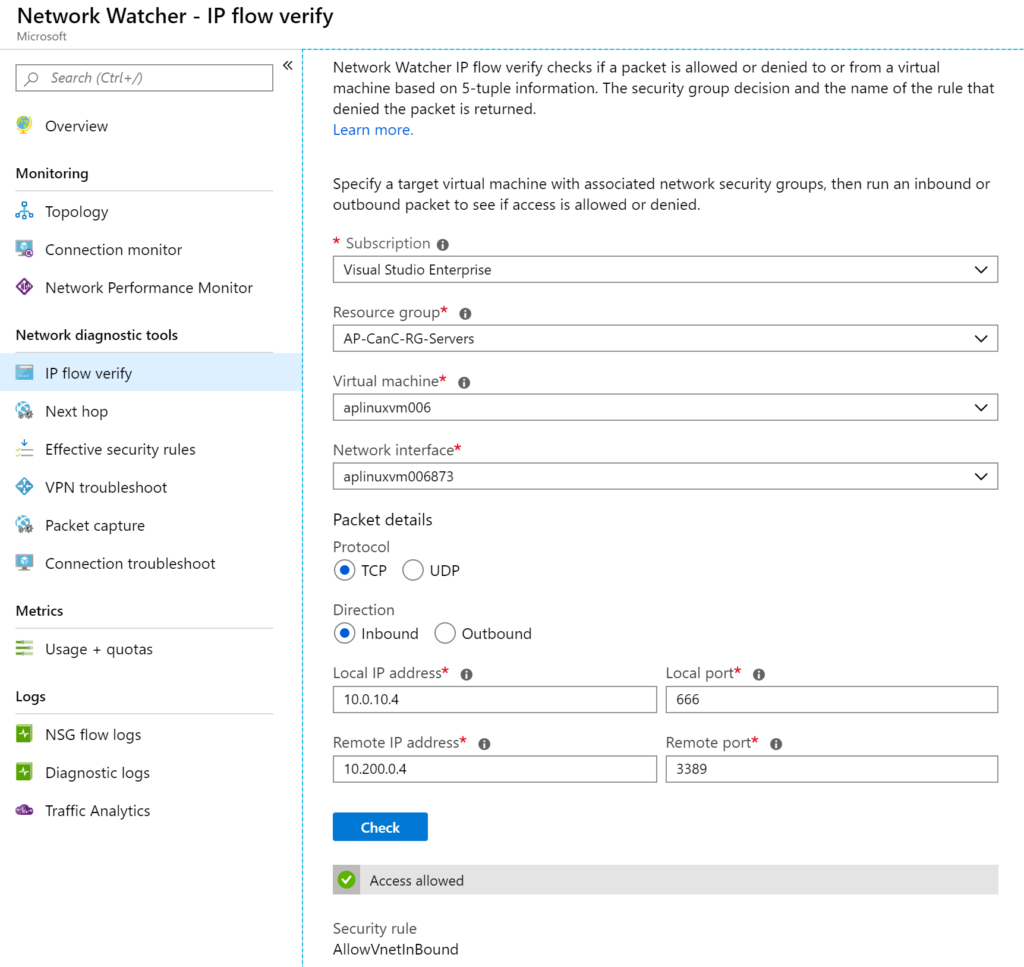
The IP flow verify checks if a provided communication will succeed or be denied based on the current configuration. It uses five pieces of information: protocol, source IP Address, destination IP address, source port, and destination port. The response will be which Network Security Group rule was in effect for the proposed traffic.
The cloud administrator needs to select the virtual machine and network interface and then provide the IP and port of the destination.
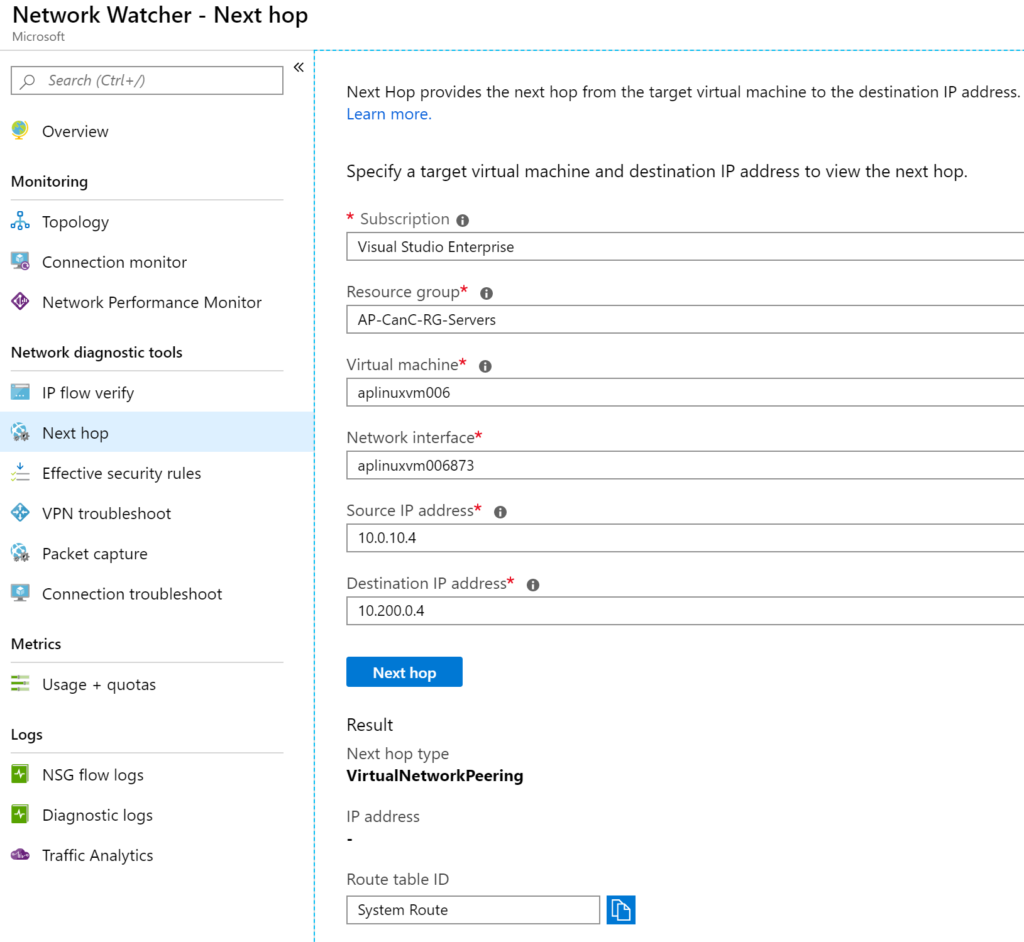
Next Hop is a simple but efficient tool. The cloud administrator needs to select any existent Virtual Machine in Microsoft Azure and the target IP. The tool will perform a simulation for that traffic and provide the type of the Next Hop and IP address (if doable). Some examples of Next Hop are Internet, VirtualNetworkPeering and virtual network.
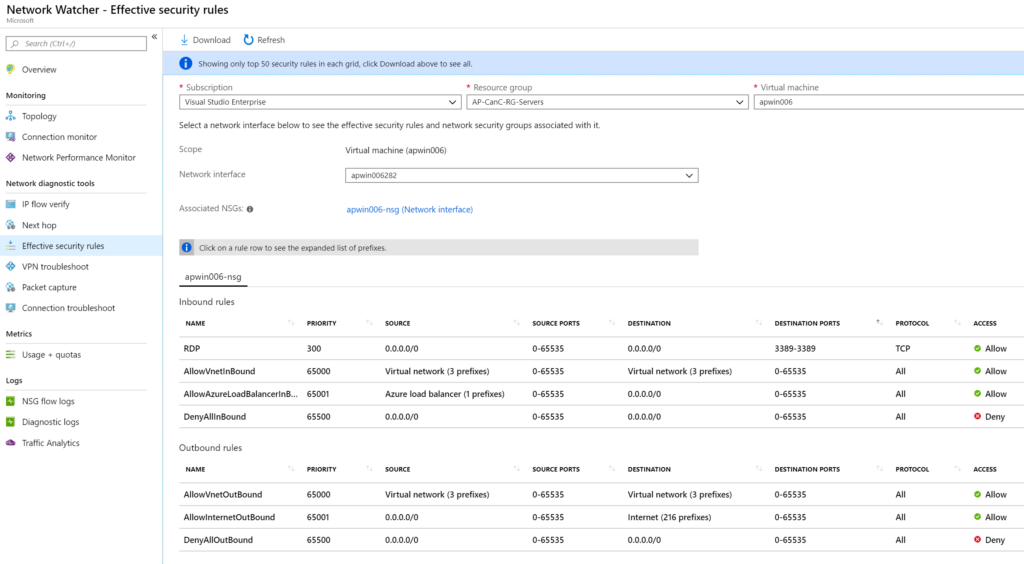
The Effective security rules tool allows the cloud administrator to select a virtual machine and its network interface. The result will be the associated NSG (if network interface or subnet level) and the inbound and outbound rules.
The Network Capture tool solves a very common request between the network and operations team when performing troubleshooting, which is the ability to capture the traffic in a given VM.
Before exploring this feature, it is recommended to create a Storage Account that will be used to save all captures. There is an option to keep in the VM that is being monitored. However, using Storage Accounts is faster to retrieve the information and gives more flexibility to share the files among different users without the need to log on to the affected server.
To start capturing, click on Add. We need to select a subscription, resource group, and virtual machine. We need to assign a name for the capture and define these following values:
- Maximum bytes per packet (0 means unlimited).
- Maximum bytes per session (1GB in bytes).
- How long the capture will work (in our article, we defined one hour).
To save time and space in the storage, we have some options to filter the traffic by selecting a protocol, source, and target addresses and ports.

All captures will be listed in the Packet capture blade. We can download the .pcap link, which can be retrieved from the Details. We can remove the capture at any time by right-clicking on it and selecting Stop.

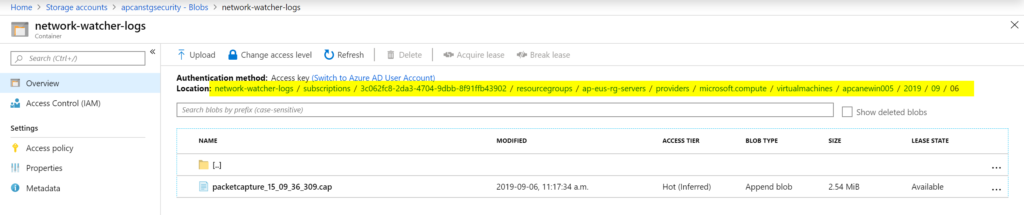
The file generated as part of the capture will be stored as a blob in the Storage Account. It is a long path that provides all the information to help identify the virtual machine, network interface, date, and Azure location of the resource in question. We can use Wireshark or any similar tool to analyze the information.
Network Watcher: Just scratching the surface
In this first article of our two-part series, we covered some of the diagnostic tools section. We saw how easy it is for the cloud to accomplish a series of tasks, such as:
- Administrator to generate traces.
- Traceroutes.
- See a diagram of the network and virtual network adapters.
- Check if the traffic is allowed.
- Check the existent security rules in-place.
Using these tools, the cloud administrator can check and validate communication issues between different resources within Azure and across networks.
For the second article in this two-part series where we look at Network Watcher Traffic Analytics, click here.
Featured image: Shutterstock