In this second of our two-part series on Network Watcher, we are going to cover some features that we didn’t have the chance to write about in the first article. We are going to complete the series by checking on Traffic Analytics, which is a great feature to have in your Azure environment.
VPN and connection troubleshoot
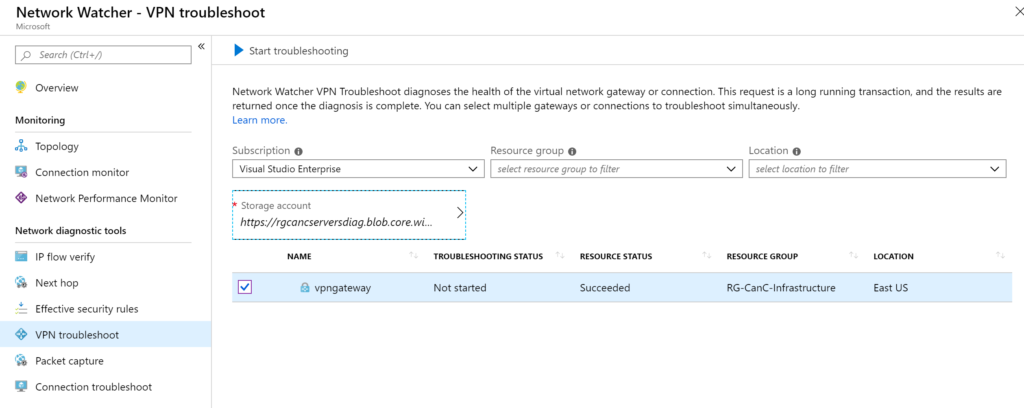
When troubleshooting hybrid cloud, the virtual network gateway component is vital to understand what is going on between Azure and on-premises. When using VPN troubleshoot, the cloud administrator needs to select a Storage Account and a container and then select one or more network gateways. After that just click on the Start Troubleshooting button.
In the connection troubleshoot item, we can pick and choose two VMs in our Azure for source and target. An agent extension is required, and it will be installed as part of the process. The response of this tool is fantastic, and it provides a lot of information that will help the cloud administrator identify the root cause of the connectivity issue. The tool shows the VMs, their IP addresses, Next Hop, the numbers of a probe sent and failed, as well as topology view.

Logs section in Network Watcher
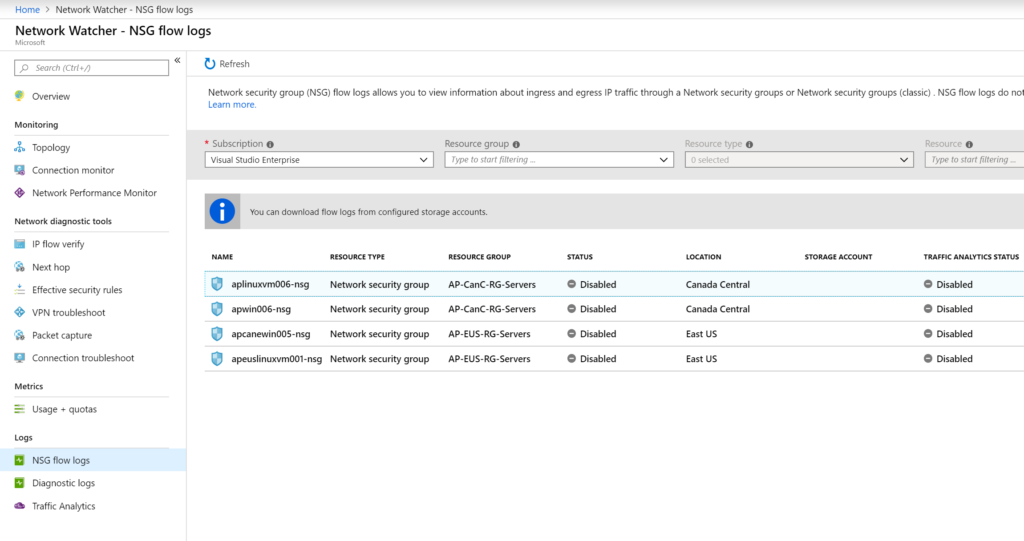
To enable Traffic Analytics, we need to start by enabling NSG flow logs. The process is simple. Click on NSG flow logs item on the left side, and a list of Network Security Groups will be listed. Click on the desired NSG.
An NSG can have flows (status column) being configured and also Traffic Analytics status (Traffic Analytics status column). We can see at a glance all the Network Security Groups and their current configuration without the need to check individual properties.
In the new blade, we can enable the flow logs and select which version. Both versions log egress IP traffic for both types of traffic, which are allowed or denied. Version 2 adds bytes and packet to the mix.
For the flows, we need to define the retention in a number of days and storage account. For the Traffic Analytics, we need to determine the frequency (1 hour or 10 minutes) and the Log Analytics that is going to be used.

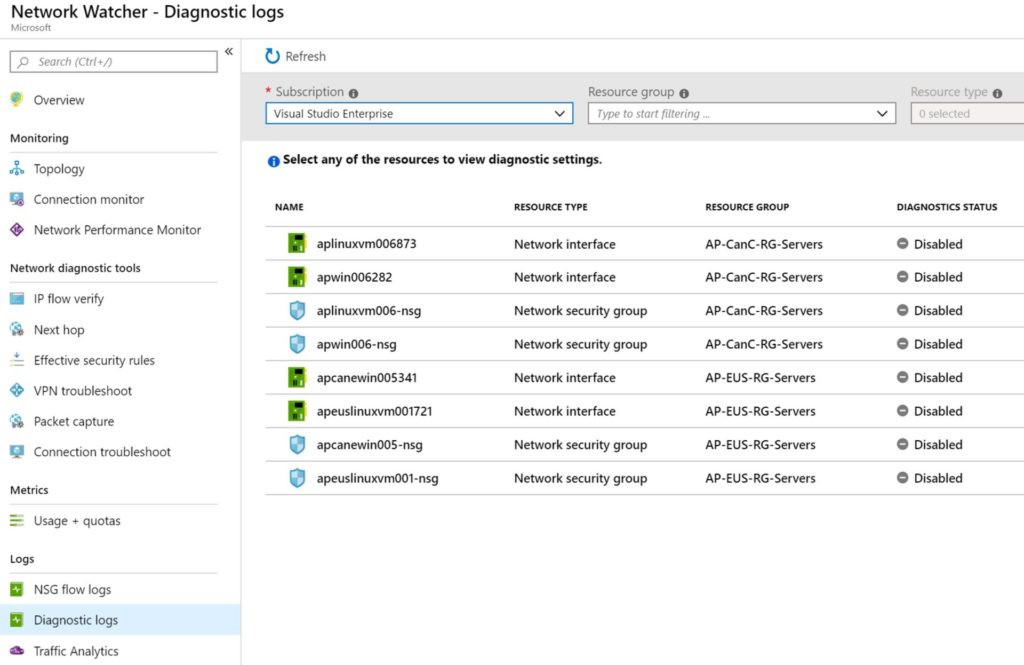
The other component of this area is Diagnostics Logs, and it will list all network components on the selected subscription. We can narrow down by resource group and resource type.
Note: If you use Azure Monitor to configure diagnostic settings, you have the same interface, but the difference is that Network Watcher lists all network-related resources in a single location.
When we click on any of the resources that we want to enable diagnostics, a new blade will be displayed. At first, it seems like a simple and annoying page that requires an additional click, but there are some subtle details on it. Here is a summary of what is available on this simple page:
- We can see any existing diagnostic settings already configured for this resource (Item 1).
- We can set a new diagnostic setting entry (Item 2).
- We can check all possible settings available even before you try to add a diagnostic setting (Item 3).
Keep in mind that diagnostic logs can send log information to event hubs, storage or log analytics. We can have more than one diagnostic log entry per resource. If you think that the process is tedious using Azure Portal, you have several options to manage diagnostic logs, here are a few options available:
- Use scripting (PowerShell or Azure CLI) after the fact.
- Define the diagnostic log settings during the ARM template deployment process.
- Use Azure Policies to enforce/enable settings.

Traffic Analytics
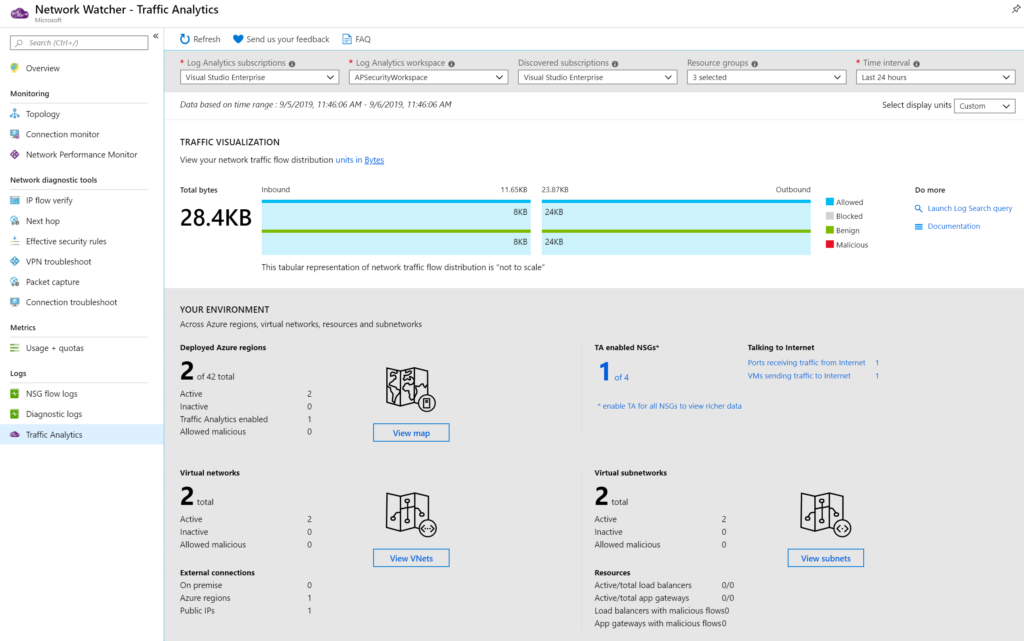
Time to explore Traffic Analytics. The initial page has a top bar where we need to select the log analytics that is being used by the Traffic Analytics (we defined that in the NSG flows) and the interval. The initial page has several sections, as follows:
- Traffic visualization.
- Your environment.
- Traffic distribution.
- Network Security Groups hits
The traffic visualization section provides a graphical view of the network traffic flow distribution (in Item 1, we can choose between bytes and flows). We also have a small section called “do more,” where we have a link to the log search (log analytics) and the documentation.
The “your environment” section is the summary of all objects, including Azure regions, virtual networks, VPN gateways, Network Security Groups, and subnet. All of them have links that will bring interactive dashboards.
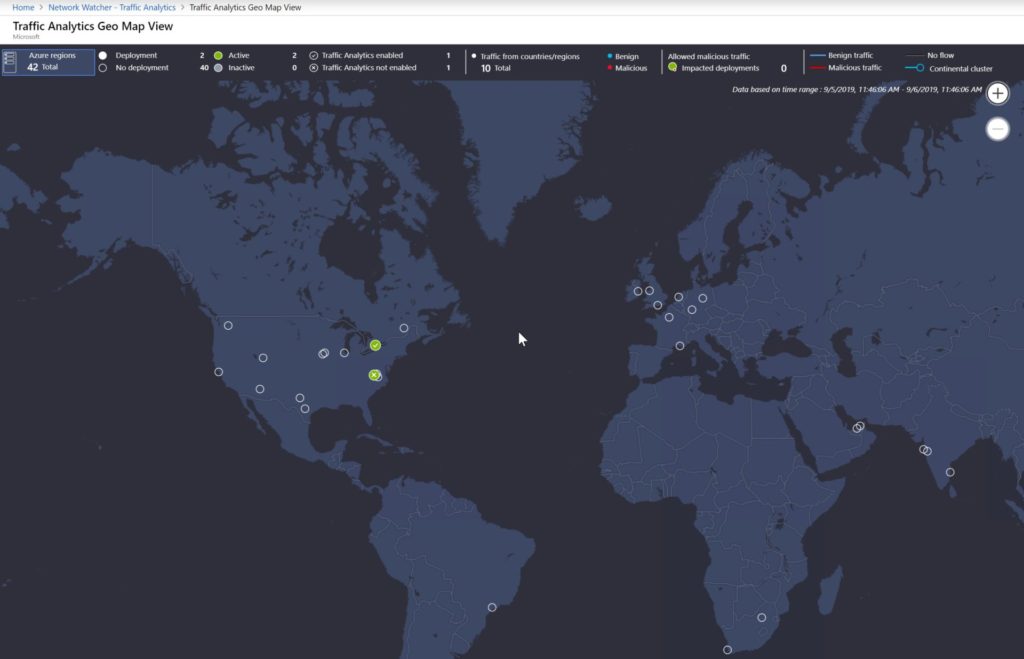
My favorite feature is the Geo Map, which provides the globe map. The administrator can select options from the top bar and the map will change interactively. We can see the Azure regions, traffic source by country/region, color-coded to identify if the traffic is benign or malicious. All points in the map allow the administrator to hover the mouse over and click on them to retrieve more information.
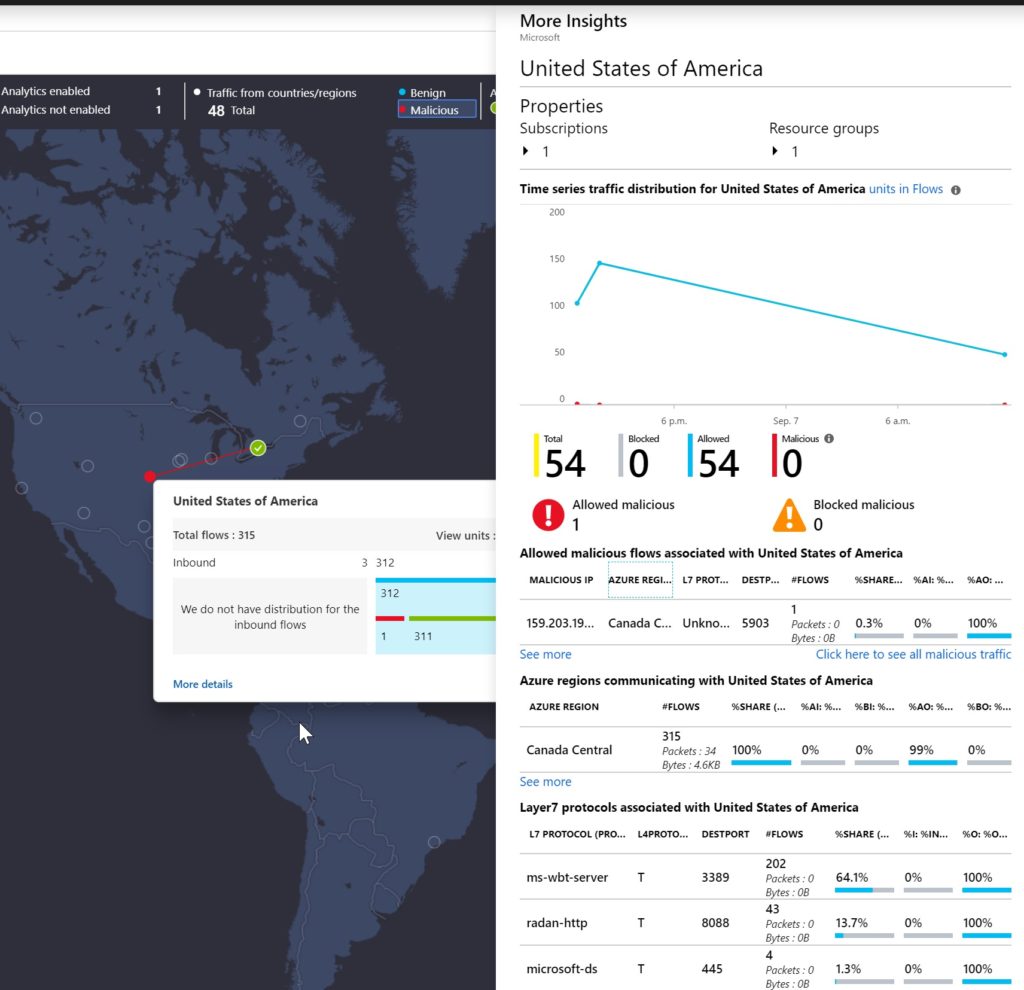
By clicking on one of the links available on the map, we will have access to a variety of information. In the example below, we click on one source IP and from that initial window, we got more insights into the United States traffic to our deployment in Canada Central region. We were able to see the malicious IP, number of flows, Layer 7 information, and so forth.
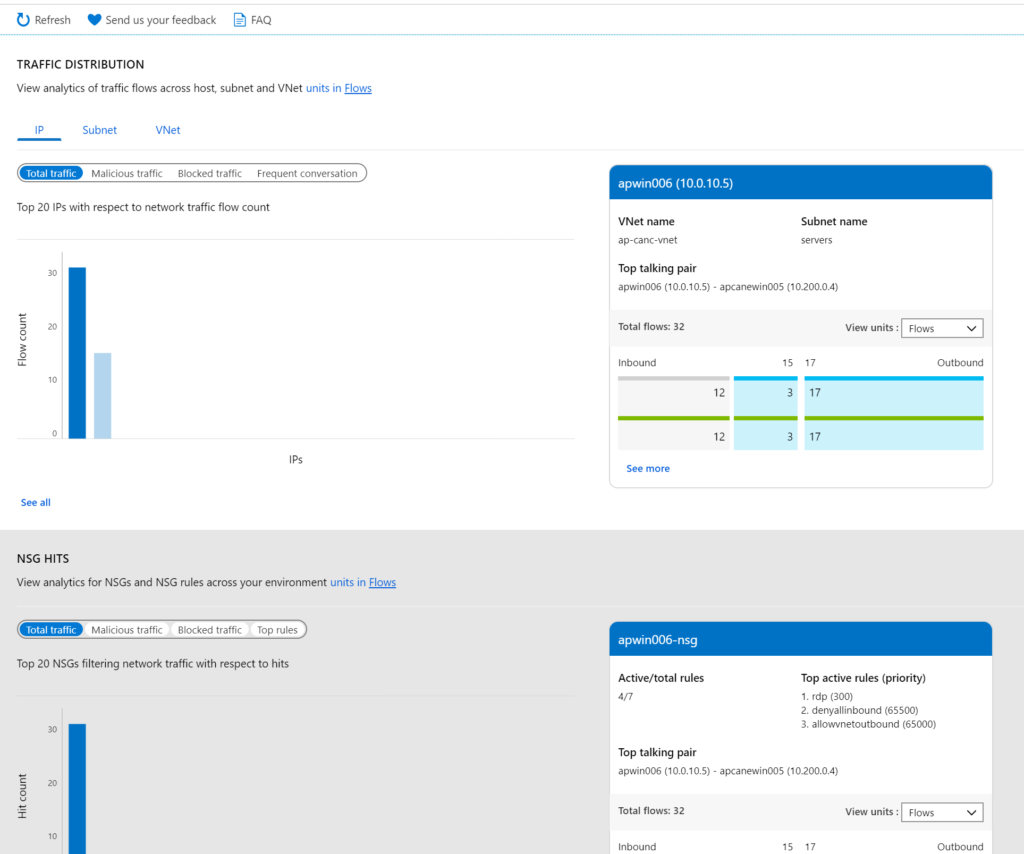
In the traffic distribution section, we can have interactive graphics of several types of traffic (total, malicious, blocked, and frequent). We can also see the numbers per IP, subnet, and virtual network net.
In the NSG hits section, we can check how the Network Security Groups and its rules data are being effective. The top active rules will be displayed automatically on the right side.
Traffic Analytics: A key part of your Azure network
In this second article, we covered Traffic Analytics, which helps to identify potential risks and understand what is going on the network piece of the Azure deployment. We also covered two other tools: the VPN and connection troubleshoot.
Featured image: Shutterstock