One of my favorite quotes of all time is from William Edwards Deming, where he says that without data, you’re just another person with an opinion. When using Power BI, I remember that quote very well because having the data we can arrange it to find answers for questions that we have not even thought to ask ![]() . Power BI is a tool that can manage the data efficiently. We can retrieve and display information from our Azure subscriptions, which gives a cloud purpose for such a profound quote. Although it is not in the resource box of many cloud administrators, we will explore how to install the tool and start checking your Azure governance with some Power BI Dashboards available to Azure customers.
. Power BI is a tool that can manage the data efficiently. We can retrieve and display information from our Azure subscriptions, which gives a cloud purpose for such a profound quote. Although it is not in the resource box of many cloud administrators, we will explore how to install the tool and start checking your Azure governance with some Power BI Dashboards available to Azure customers.
We will explore the Power BI Dashboard Governance, which includes information about management groups and subscriptions, resource groups and resource tagging, Azure security and compliance, Azure Policies, Azure subscription blueprints, and, last but not least, regulatory standards compliance overview.
This article aims to show how to download the Power BI Desktop, download your first dashboard, and start using it to manage your Azure environment. The permission required to execute the steps provided in this article is for a reader at the subscription level.
Installing Power BI Desktop
The first step in our journey is the installation of Power BI Desktop software on your workstation. The software is available in 32 and 64 bits. Visit this Microsoft website and download your version (64 bits is recommended).
The installation process is straightforward. On the first page, we will be selecting the language and then click Next to continue and follow the installation process. The final page of the installation wizard will be a message saying (hopefully) that you have completed installing Microsoft Power BI Desktop. Click on Finish, but before doing that, make sure that you select Launch Microsoft Power BI Desktop.
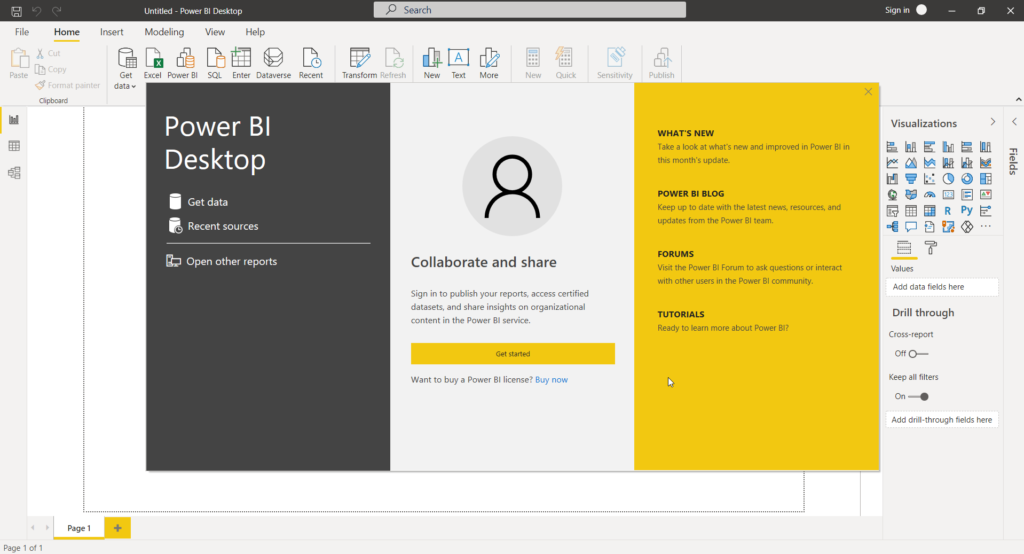
The image below shows the Power BI Desktop welcome page with information to get started, a blog, and some hints to start using the product. Don’t worry about that at this moment.
One important note to mention is that a new folder structure will be created under the Documents folder as part of the installation process. A new folder called Power BI Desktop and a subfolder called Custom Connectors will be created. Please pay attention to that path because we will need to use it in the following section.
Installing the Custom Connector
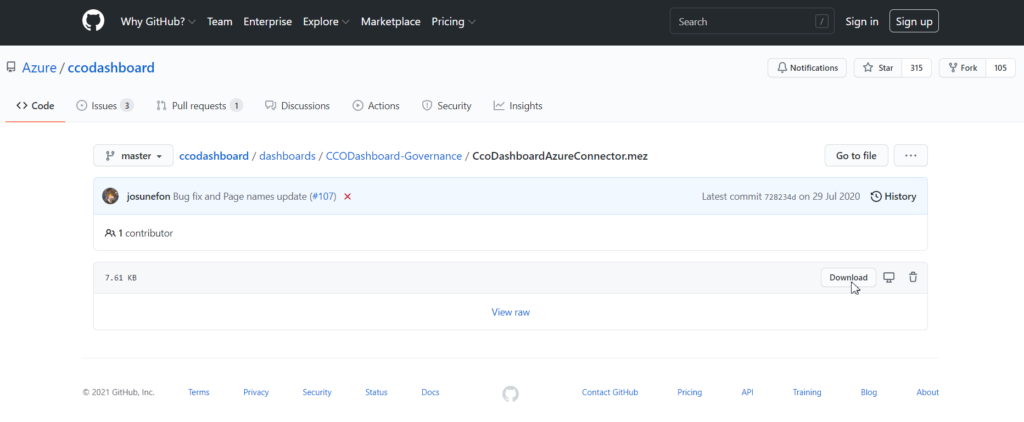
The magic happens with a Custom Connector in the Power BI world. We will be using one called CCODashboardAzureConnector.mez, which can be found on this GitHub location here.
GitHub sometimes is not easy to navigate but hit the download button (highlighted area in the image below).
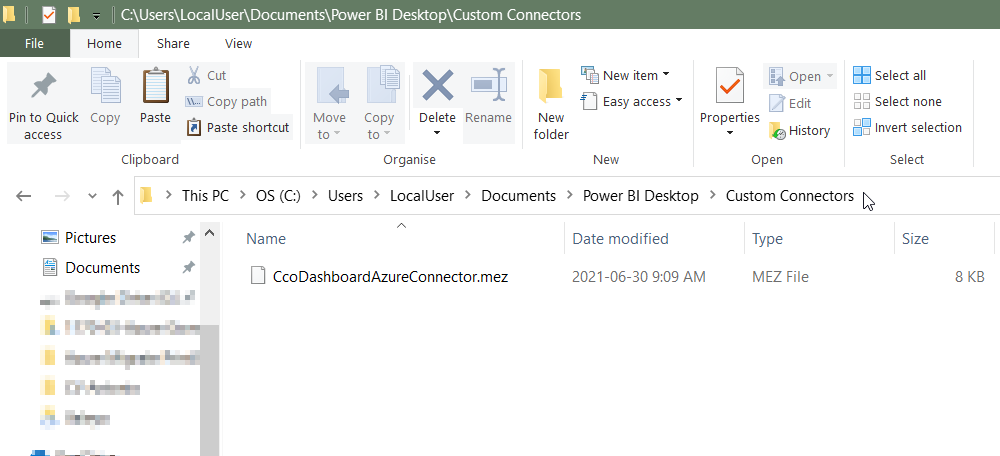
This is an important step. Make sure that you save the file you have just downloaded to the following path: C:\Users\<username>\Documents\Power BI Desktop\Custom Connectors folder, where you should replace <username> for the current user. The final result should be something similar to the image below.
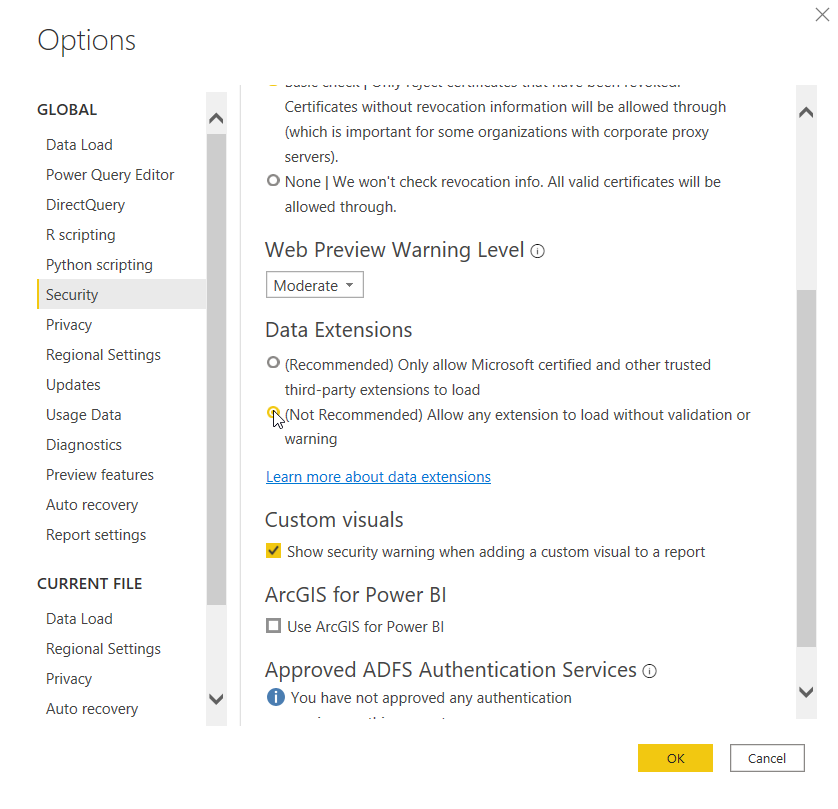
Time to start configuring the Power BI Desktop. After opening the application, click on File, Options and Settings, and then click on the Options item located on the right side.
On the Options page, the first stop is in the Security item under GLOBAL. In the Data Extensions section, select “(Not Recommended) Allow any extension to load without validation or warning.”
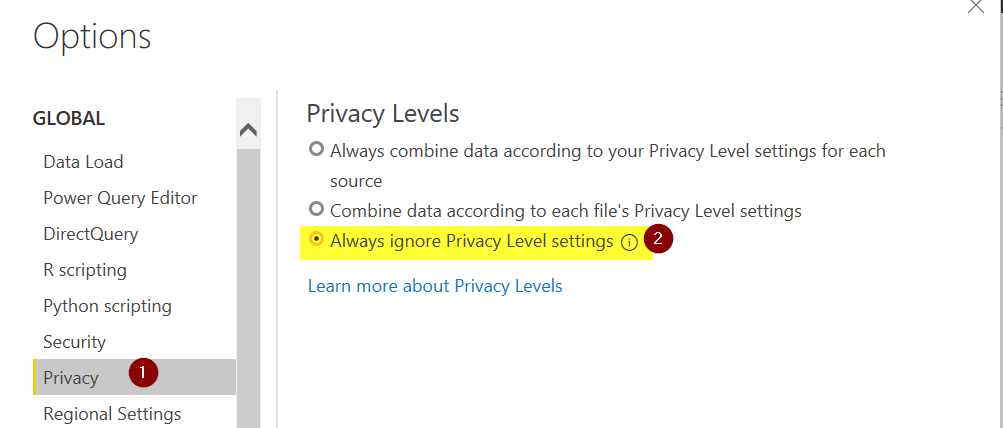
The second step is to click on Privacy (Item 1) and then select “Always ignore Privacy Level Settings” (Item 2). Click OK, and you will be prompted to restart Power BI Desktop. Make sure you do it.
Getting the PowerBI template
Now that we have all the plumbing configured, including the Power BI Desktop software, Custom Connector, in the right place, our next logical step is to download the Power BI Dashboard file. This file can be found here.
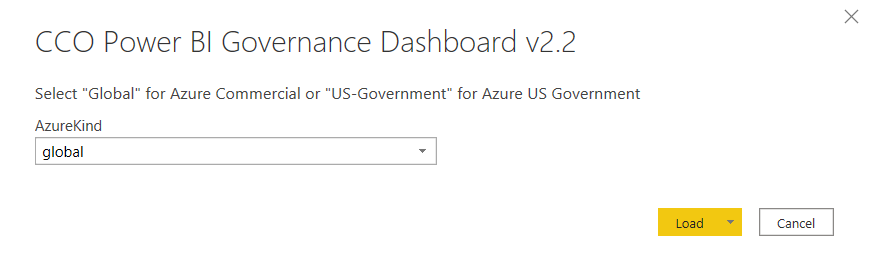
You can save this file in any location on your computer. Double click on it to open it. The first page will be selecting your Azure environment (I believe that for 95 percent of the readers, the option will be Global. If you are Government, then select that one), and click on Load.
On the Access Web Content page, click on Organizational Account, click on Sign in, and follow the required steps to authenticate to Azure. Note: There is the current status right above the sign-in button, and it will change when you are authenticated.

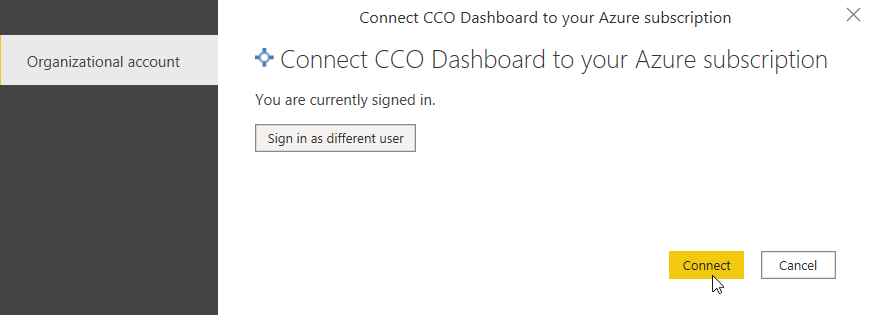
You will be prompted to enter your credentials again on the “Connect CCO Dashboard to your Azure subscription” screen. Just type your credentials again and click on Connect.
Exploring the Dashboards
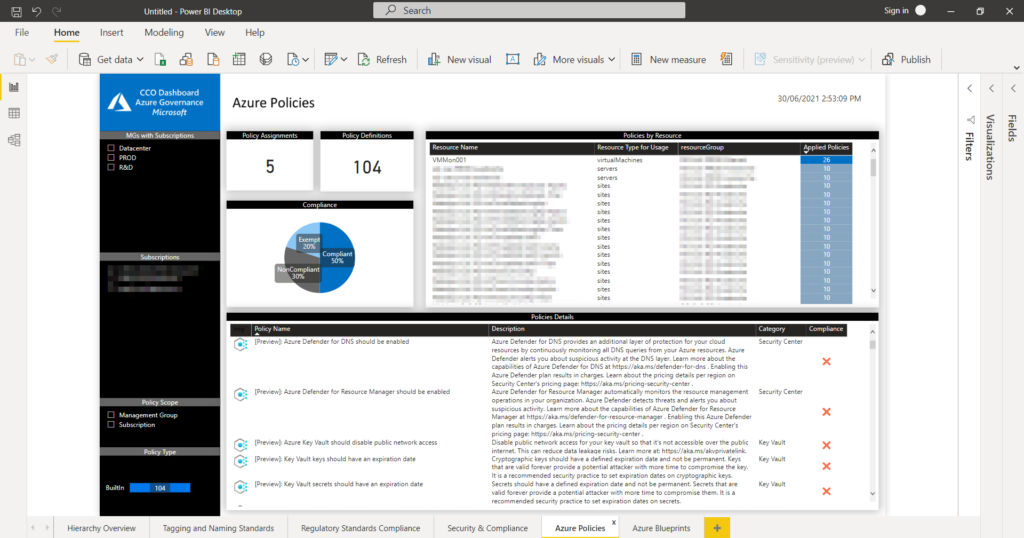
At this point, we will have all dashboards available (Item 1), and we can pick and choose the ones that we want to check. In the Azure Resources Security, Compliance and Regulatory Standards, we can have a nice view of all resources, their health status, and so forth. We can always filter the information by subscription, policy set, and regulatory standards.
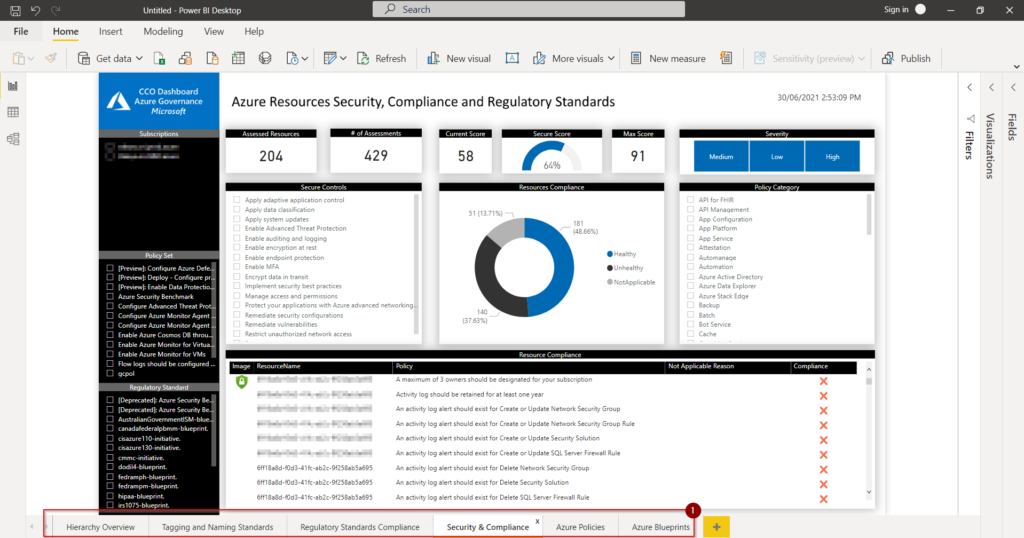
The filer and selection criteria are based on the dashboard. For example, in the Azure Policies, we can select the subscriptions, management groups, and policy scope.
Getting everything together … the lazy way!
We created three lines of code to download the Custom Connector and the Dashboard that we presented in this article. You can copy and paste the content below and save it as ps1 and execute it on your workstations. A folder in the C:\Techgenix-AzureGovernance will be created (as long as you have permission), and the files will be placed there.
New-Item -Path "c:\" -Name "Techgenix-AzureGovernance" -ItemType "directory"
Invoke-WebRequest -Uri "https://github.com/Azure/ccodashboard/blob/306a7b36e5ee3662eab12e04687c90a5f0ccf49c/dashboards/CCODashboard-Governance/CcoDashboardAzureConnector.mez" -OutFile "C:\Techgenix-AzureGovernance\CcoDashboardAzureConnector.mez"
Invoke-WebRequest -Uri "https://github.com/Azure/ccodashboard/raw/master/dashboards/CCODashboard-Governance/CCO%20Power%20BI%20Governance%20Dashboard%20v2.2.pbit" -OutFile "C:\Techgenix-AzureGovernance\CCO Power BI Governance Dashboard v2.2.pbit"
Your Power BI Dashboard is up and running
In this article, we covered the required steps to build a control platform of your Azure environment without going to the Azure Portal, just using data gathered by the Power BI Dashboard from your Azure subscriptions to provide rich reporting capabilities about the current status and health of your Azure environment.
Featured image: Shutterstock


Hi Anderson,
I am interested in the PBI Governance Dashboard
I have installed/configured CCO Power BI governance dashboard v2.4, all queries are populated correctly except the 5 queries related to the CcoDashboardAzureConnector.Management custom connector
I’ve downloaded the most recent version and copied the CcoDashboardAzureConnector.mez file in
C:\Users\xxxx\Microsoft\Power BI Desktop Store App\Custom Connectors
C:\Users\xxxx\Documents\Custom Connectors
C:\Users\xxxx\AppData\Local\Microsoft\Power BI Desktop\Custom Connectors
C:\Users\xxxxx\Documents\Power BI Desktop\Custom Connectors
And I changed the Global settings as required
Still PBI is throwing the error that it cannot connect to the connector
Can you please help?
Ludo
Resolved!
I found that the folder structure must be the following regardless if PBI was downloaded from the App Store or not
C:\Users\xxxx\OneDrive – YYYYY\Documents\Power BI Desktop\Custom Connectors
And One Drive must be paused at the first refresh attempt!