Product: SolarWinds Network Performance Monitor 12.2
Learn more/Product Homepage: click here
Download a Free Trial: click here

Over the last several years, I have been fortunate to have has the opportunity to review multiple versions of SolarWinds® Network Performance Monitor. Each new release I have reviewed has included new functionality, so I was curious to see what’s new in version 12.2.
Installation
Before I begin talking about what is new with this release, I have to mention the installation process. SolarWinds gave me the option of performing either an online or an offline installation. It is possible that SolarWinds may have offered an online option in the past, but I can’t recall ever having used it. The great thing about the online installer, which you can see in the figure below, is that it frees you from having to manually download the software and ensures that you have the latest version of the software.
I also love that SolarWinds gives its customers the option of performing either a lightweight or standard installation. I’m sure that most organizations will opt for the standard option, but by offering a lightweight option, SolarWinds is making it easy for customers to try out Network Performance Monitor (NPM) without investing a huge amount of time into the deployment process.

Since I am conducting this review in a lab environment, I performed a lightweight installation. I found the installation process to be completely effortless.
What’s New?
If you are curious as to what is new in the latest version of NPM, you need only look at the NPM Summary screen within the management console. As you can see in the figure below, SolarWinds lists all of the new features right on the summary screen.

SolarWinds has made a few improvements to PerfStack™, such as real-time polling for key metrics and support for some new metrics such as UnDP, Syslog, and SNMP traps. Additionally, there are other minor improvements such as integrating search into global navigation and making the dashboard easier to customize. By far the biggest improvement to NPM 12.2, however, is Network Insight™ for Cisco® ASA. Since most of the work that SolarWinds has done in this version seems to be related to Cisco ASA support, that is what this review will focus on.
Adding Cisco ASA Firewalls to the Managed Device List
The first thing that I wanted to do was to see what was required in order to add a Cisco ASA firewall to the list of managed devices. The process was surprisingly easy. I simply selected the Manage Node option from the Settings menu to get to the Manage Nodes screen, and then clicked on the Add Node link. This brought up the Add Node screen. From here, you can simply enter the IP address of your device, and then set the polling method to Most Devices: SNMP and ICMP, as shown in the figure below. Although not shown in the figure, there is an Additional Monitoring Options section at the bottom of the page that contains a check box that you can use to enable Advanced Cisco ASA Monitoring.

The ASA Infrastructure
Once you have added one or more Cisco ASA devices to Network Performance Monitor, there are a few different things that you can do. For starters, there is a really nice Node Details summary that you can use to see exactly what is going on with the device at a glance.
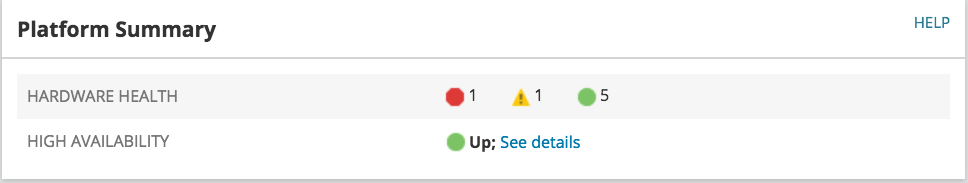
This dashboard view is divided into several different sections, beginning with a Details pane that helps you to identify which ASA device you are looking at. There’s also a Platform Summary pane that uses a series of simple icons to show you the number of errors and warnings that have been detected on the device, as well as the high availability status.
The details summary also has a Management section with links to management-specific tools and tasks. For example, there is a link you can use to place the node into maintenance mode. Similarly, there are links to tools such as TraceRoute, Response Time Monitor, and tools for monitoring CPU and memory use. I found the links in this section to be very helpful. After all, it is one thing to be able to view a node, but it is quite another thing to be able to manage and troubleshoot a node from within the console.

The console also provides an overview of the ASA device’s recent usage. By default, usage is monitored over a 24-hour period, but the time period is adjustable. Among the recent usage statistics are a load summary, a device status report, and a summary of both the inbound and outbound bandwidth usage.

Although much of the information in the dashboard is related to health and maintenance, NPM also provides the ability to monitor VPN tunnels. This includes both site-to-site tunnels and remote access VPN tunnels. The Summary view shows an overview of site to site VON usage. A site-to-site VPN Health Overview pane shows a pie chart indicating how many site-to-site VPNs are up, down, or inactive. Similarly, a Favorite site-to-site VPN pane shows the IP addresses associated with commonly used VPN tunnels, as well as the bandwidth usage for each tunnel and the tunnel’s duration and any health-related information.

If you need to access more detailed information about a VPN tunnel, you can do so by clicking on the ASA firewall node, and then drilling down into the Node Details view to access either the Site-to-Site VPN or the Remote Access VPN option. Upon doing so, the console will display information for each tunnel, including information such as the tunnel status, encryption used, the upstream and downstream transfer rate, and tunnel duration.
Personally, I think that SolarWinds has done a really good job with creating the dashboard view. What I like about it is that the dashboard cuts through the clutter and displays the information that is likely to be the most relevant to network admins, such as general health, utilization, high availability, and performance. What I really like though, is that the Summary dashboard is only one of the dashboards that is available for ASA devices. NPM has a completely separate Platform dashboard that provides more detailed information about connections (and connection rates), RAM and CPU usage, high availability, and hardware health.
Another Node Details dashboard provided within the software is the Interfaces dashboard. The Interfaces dashboard gives you detailed information about the individual network interfaces. Using this dashboard, you can monitor inbound and outbound traffic, as well as the interface’s status.
Earlier, I mentioned that SolarWinds NPM provides information on site-to-site and remote access VPNs. As you might have guessed, there are separate dashboard views for each. These dashboard views provide the basic information that you would probably expect, such as upstream and downstream data usage and VPN duration. What makes these dashboards more noteworthy, however, is that they allow for rich filtering. For example, you can filter by link state, bandwidth usage, and client type, just to name a few.
The Verdict
When I write a review for this site, it has become customary to assign the product a numerical star rating ranging from zero to five, with five stars being the highest possible score. After careful consideration, I decided to give SolarWinds Network Monitor version 12.2 a score of 4.9, which is a gold star award.
Although this review focused primarily on one new feature, Cisco ASA firewall support, all of the features found in Network Performance Monitor 12.0 and 12.1 still exist. You can find my review of the 12.0 release here and my review of version 12.1 here.
In my opinion, version 12.2 is going to be a very worthwhile upgrade for most organizations. Cisco Adaptive Security Appliance firewalls are among the most popular firewalls used in enterprise-class environments, so adding management and monitoring support for these firewalls to Network Performance Monitor adds real value to the product.
TechGenix.com Rating 4.9/5
Learn more about SolarWinds Network Performance Monitor or download a free trial.
The author received compensation for their honest review. All thoughts and opinions expressed herein are their own and not influenced by the developing company, and/or its affiliates, in any way.