Product: SolarWinds Server and Application Monitor Version 6.4
Learn More/product homepage: click here
Download a free trial: click here

SolarWinds Server and Application Monitor has been around for quite some time, but the company has recently released version 6.4. This latest version of Server and Application Monitor (SAM) has a number of new features, which are outlined in the Release Notes. For the purposes of this review, however, I want to focus on two of these features that I think will have the most value to IT pros – PerfStack and the ability to monitor AWS resources.
PerfStack
PerfStack is designed to help administrators troubleshoot performance problems by allowing them to view a wide variety of performance metrics side by side, in a graphical format.
PerfStack is accessible by choosing the Performance Analysis option from the Orion console’s My Dashboards menu. Since no analysis projects exist by default, I decided to use PerfStack to take a look at an Exchange Server within my lab. Prior to doing so, I worked through the discovery wizard so that SAM would be aware of the servers and applications running within my lab.
I have worked with a number of different performance monitoring tools over the years, and have found that such tools tend to be at least somewhat difficult to use. That being the case, I was expecting PerfStack to be cumbersome and nonintuitive. I was happy to discover, however, that PerfStack is surprisingly easy to work with.
The first thing that you have to do when using PerfStack is to create a new analysis project. To get started, you simply click the Add Entries link, and then select the servers that you want to monitor.
The next step in the process is to use something that SolarWinds calls the Metric Palette to create the performance monitoring stack. The basic idea behind the Metric Palette is really simple. For each server that you add to a project, there are certain aspects of that server’s performance that can be monitored. These metrics are initially grouped by server and by category. If you look at the screenshot below, for example, you can see that I have added two servers to an analysis project – a domain controller and an Exchange server. In the screenshot below, I have selected the Exchange Server. To the right of the list of servers, you can see a list of categories including things like CPU / Memory, CPU Multi Load, and Response Time. Each of these categories contains a collection of metrics. I have expanded the CPU / Memory category to reveal the eight metrics within it.

One more thing that I want to point out is you will notice that the metrics that are shown in the above screenshot are server specific. For example, the Minimum CPU Load tile says E2K216, which is the name of my Exchange server.
Each of the metrics listed within the Metric Palette can be dragged and dropped to the big white area on the right side of the screen. You can use metrics from multiple servers (or from a single server) and arrange those metrics in any way that you want.
Since Exchange Server has a dependency on the Active Directory, I wanted to see how the Exchange Server’s maximum and average response times compared to the maximum and average response time of my domain controller. As such, I dragged the Average Response Time (LabDC1), Average Response Time (E2K16), Maximum Response Time (LabDC1), and Maximum Response Time (E2K16) tiles to the canvas.

SolarWinds did an extraordinarily great job with the chart creation process. The first time that you drag a tile to the canvas, that tile instantly becomes a chart. When you drag another tile to the canvas, PerfStack gives you a choice of either creating a second chart, or adding the metric to the existing chart. The console is designed in such a way that you can create a number of different charts, and each chart can include multiple metrics. The thing that I liked about this is that SolarWinds has made it so incredibly easy to create the charts. Furthermore, it is possible to save a PerfStack project so that the chart configuration can be used again.
Monitoring the Amazon Cloud
SAM previously provided the ability to monitor applications and servers in the cloud via VPN connectivity or agents. As previously started, they now have extended that ability to monitor AWS resource through direct integration with AWS APIs. To get started, all you have to do is choose the Cloud option from the Orion console’s My Dashboards menu, and then click on the Monitor My Cloud Instances button.
In an effort to see how this new capability worked, I signed into my AWS account and created a new Windows Server instance. I then clicked the Monitor My Cloud Instances button within the Orion console, and was taken to the screen shown below. This screen outlines the process of setting up monitoring for AWS instances. Even though the screen shown below doesn’t really do anything, I appreciate that SolarWinds takes the time to show you what the process consists of before you begin configuring anything.

Connecting to AWS involves entering your account’s access key ID and your secret access key. This was the one area in which I encountered some problems. When I attempted to provide my secret key, I kept getting error messages saying that the key needed to include five slash delimited fields. After a few tries, that error went away and was replaced by an error indicating that my credentials could not be validated. I waited a few minutes and tried again, and my credentials were accepted. Although this seems like a glitch, I am willing to give SolarWinds the benefit of a doubt, because I had created a new set of keys within AWS, and it is possible that those keys took some time to propagate throughout the system.
Upon clicking Next, SAM detected the instance that I had set up within AWS, and gave me the option of monitoring the instance.

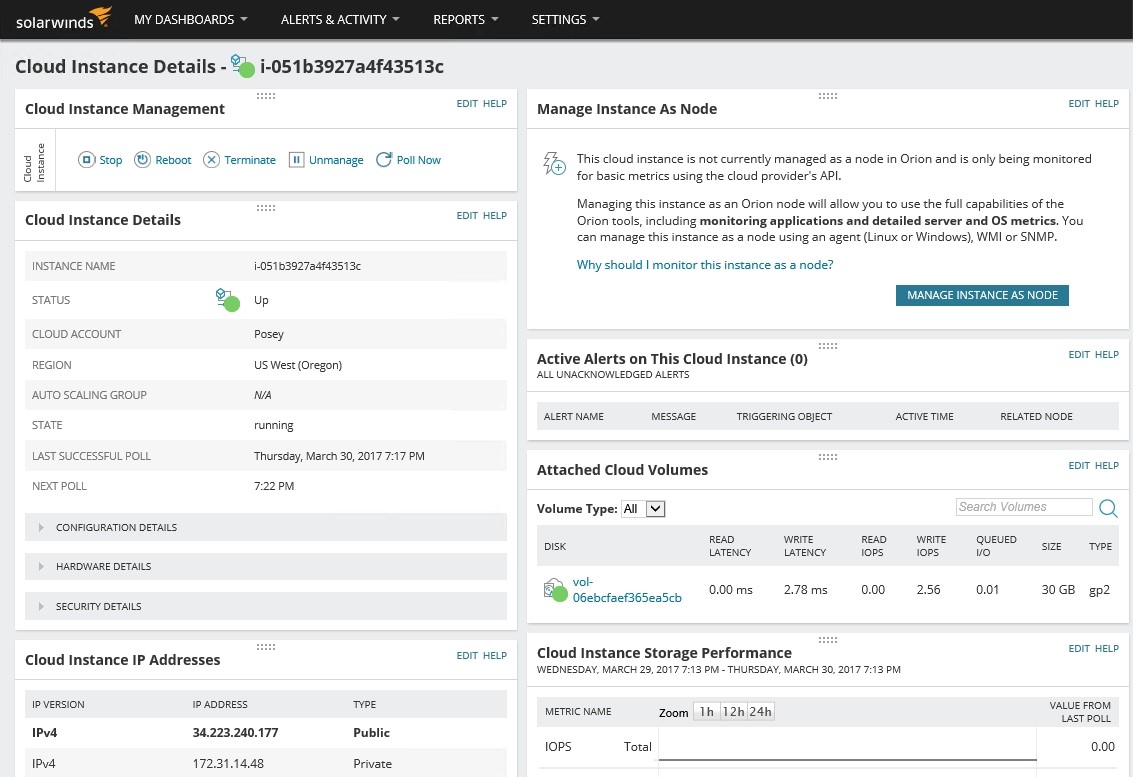
Once the instance had been set up for monitoring, it took a few minutes for the polling process to collect data from the instance. Eventually however, the Cloud dashboard was able to display a significant amount of data about the instance. This information included configuration details, hardware details, security details, and information about things like IP address usage and cloud volume usage.
SolarWinds also gives you the option of managing the cloud instance like any other node by installing an agent onto the node. Although I expected the agent deployment to be a completely manual process, SolarWinds uses a wizard to walk you through the process.

The verdict
When I write a review for this site, it has become customary to assign the product a numerical star rating ranging from zero to five, with five stars being the highest possible score. After giving it a lot of thought, I decided to give SolarWinds a score of 4.9, which is a gold star rating. I think that SolarWinds did an exceptionally good job on this latest version of SAM, especially with regard to PerfStack, which I can see myself using on a regular basis.
TechGenix.com Rating 4.9/5
Learn more about SolarWinds Server & Application Monitor or download a free trial.