Over the years I’ve written some really complicated PowerShell scripts, both for personal use and for some articles I write on this site. Although these script types do have their place, they can be exceedingly difficult to debug. This can be especially true for scripts that contain many functions or numerous logic gates.
You can make the debugging process easier by using the Set-PSDebug command. In this article, I want to show you a technique for tracing the script execution.
First, let’s start with the Set-PSDebug cmdlet and how we can use it to trace the script progress at runtime.
The Set-PSDebug cmdlet
The Set-PSDebug cmdlet is simple to use, yet it can be an invaluable tool for figuring out what your script is doing. You can use it to understand why it isn’t working in the way that you expected.
Setting the Trace Level
When you use the Set-PSDebug cmdlet, you’ll need to tell PowerShell what trace level you want to use. To specify the trace level, append the -Trace parameter to the Set-PSDebug cmdlet. You’ll also need to add the number reflecting the trace level you want to use. The valid trace levels include:
- Tracing is disabled.
- Basic tracing is used, and PowerShell displays the line number that is being executed.
- In addition to tracing line numbers, PowerShell also traces variable assignments, function calls. It also can call external scripts.
Performing a Basic Trace
You can trace code from any PowerShell session. In this article, I’ll be using PowerShell ISE because it makes the screen captures a little bit easier to follow. To perform a basic trace on a script:
- Open a PowerShell session.
- Run the following command: Set-PSDebug -Trace 1
- Run your script.
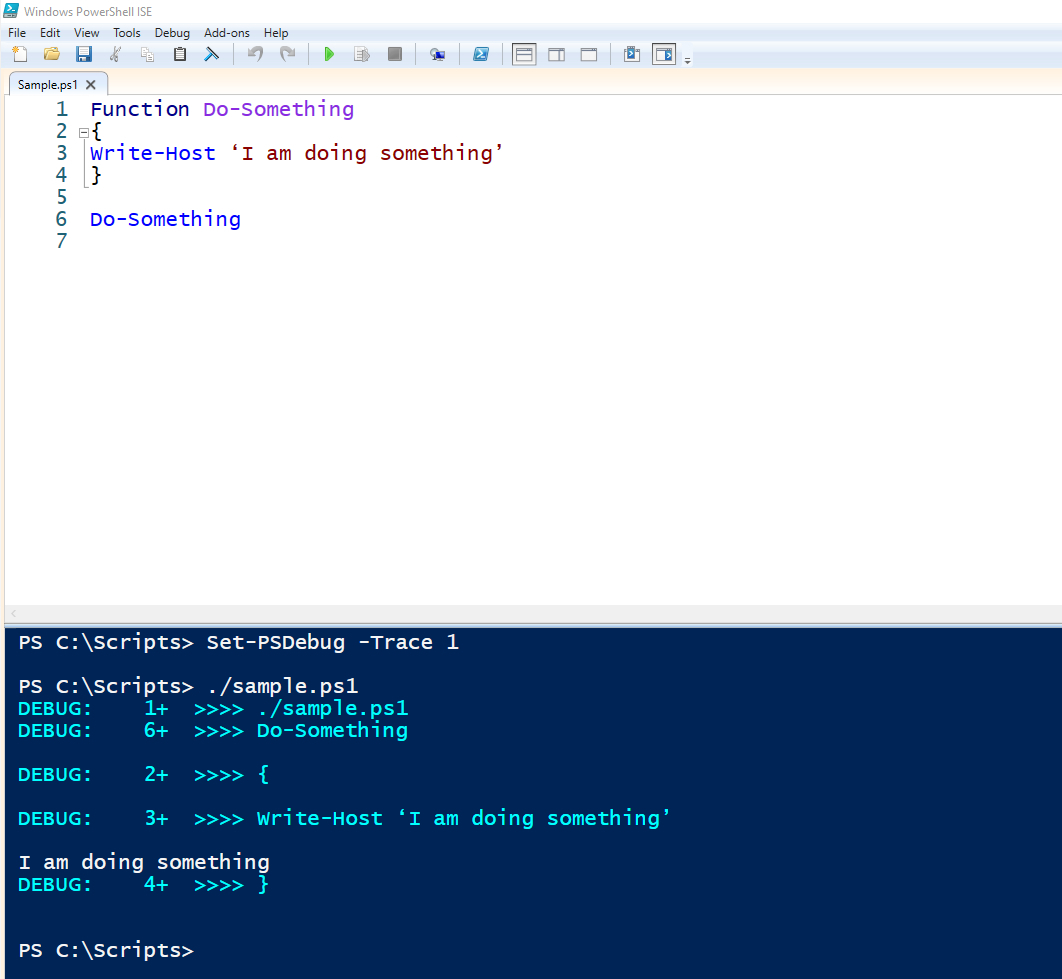
If you look at the image above, you can see I’ve opened a script in PowerShell ISE and then performed a basic trace on that script. In this case, the script starts with a function, so the first code line to actually execute is line 6, which calls the function. Notice that the trace uses the word Debug to show debugger information. It then displays a line number; 6 in this case. The instruction is added to that line.
Once the function is called, the trace reveals that the script runs line 2; an opening bracket. Following this in line 3, a Write-Host statement is present. In line 4, a closing bracket. When line 3 executes, PowerShell doesn’t show the line number and the command. It also displays the output that is being generated by that code line. Here the output is text that says, “I am doing something”.
Performing a More Comprehensive Trace
Now that you know how to perform a basic trace, let’s perform a more comprehensive one. The process is exactly the same as before, except this time we will need to set the trace level to 2. Thus, the Set-PSDebug command will be: Set-PSDebug -Trace 2.

You should note I added two code lines to the function; lines 4 and 5. Both lines here are variable assignments. They don’t really do anything with regard to the script’s functionality. I only put them there so I could show you how variable assignment tracing works.
That said, you’ll notice trace information is like what you saw before. You’ll also notice this time, the trace output lists the function that’s running. If you look down the trace results, you’ll see PowerShell also returns the $A variable. You can see the variable assignment line and the value that was actually assigned to the variable.
Final Thoughts
Long or complex PowerShell scripts can be difficult to debug, but the Set-PSDebug cmdlet makes the debugging process a lot easier. A level 1 trace shows you the sequence lines are run in, while a level 2 trace also shows you variable assignments and function calls.
FAQs
Does PowerShell count blank lines when a trace reports line numbers?
Yes, blank lines are treated as code lines. If a PowerShell script contained four lines, a blank line, and then another code line, then the blank line would be considered line 5. This would never execute because it’s blank and the last line is number 6.
If a PowerShell Level 2 trace produces more detailed output, is there ever a reason to do a Level 1 trace?
Sometimes a Level 2 PowerShell trace can produce too much information to digest. If you’re trying to keep things simple, then you might want to start with a Level 1 trace and see where that gets you.
How do you turn off a PowerShell trace when you are done?
Set the trace level to 0 by typing: Set-PSDebug -Trace 0 into your PowerShell script. This helps stop unnecessary tasks from running that reduce your systems performance. If you have logging enabled then stop your system being filled with log files by disabling these at the same time. Forgetting to disable logs can cause a system down event as your storage fills up.
Does the PowerShell Set-PSDebug cmdlet support any other parameters?
Use a -Step parameter in PowerShell. Adding this to a Set-PSDebug cmdlet causes the script to pause after each line and wait for permission to execute the next code line. A -Strict parameter forces strict mode to run. This stops the script if something falls to run correctly.
What can you do if Set-PSDebug produces an output that scrolls off the PowerShell’s screen?
If Set-PSDebub creates a long output, then you can dump the output to a file by creating a transcript. Unfortunately, you can’t change the terminal to accommodate the output length. This is intentional and a part code, part security feature that PowerShell offers.
Resources
Microsoft’s Official Documentation on the Set-PSDebug
Get Microsoft’s documentation for Set-PSDebug here.
Tracing PowerShell Scripts
Read more about tracing a script here.
Github PowerShell Resources
Find GitHub resources related to PowerShell tracing here.
Finding the PowerShell Version
Discover how to determine the PowerShell version you’re using here.
Malicious PowerShell Scripts
Learn about malicious scripts here.
Troubleshoot PowerShell Direct Errors
Find out how to troubleshoot PowerShell Direct errors here.