Let’s begin
Troubleshooting Forefront TMG problems can be complicated and time consuming because of the various possible types of problems. Independently from available tools and techniques for troubleshooting Forefront TMG problems, you should follow the concept called KISS (Keep it simple, Stupid!). KISS in my opinion means; start with some simple troubleshooting approaches before you start with Kernel debugging :). With KISS in mind you can start troubleshooting with simple questions like: Does it work from other clients? Is the problem repeatable? Does it worked a while ago?
Please keep in mind:
This article doesn’t give you solutions for specific problems. This guide was written to give you an overview about troubleshooting technologies and tools with the goal that you can apply some tools to troubleshoot your specific problems.
For this article I will give you some insights into the following tools and techniques:
- Forefront TMG Dashboard
- Forefront TMG Logging
- Windows Event viewer
- Forefront TMG log files
- Forefront TMG Best Practice Analyzer
- Forefront TMG Data Packager
- Microsoft Network Monitor (Netmon)
- TMG built in tools
- NETSH
- Forefront TMG Diagnostic Logging
- FWENGTRACE
- ISATRACE
- Perfmon
- PAL (Performance Analysis of Logs)
- TMG Superflow
Forefront TMG Dashboard
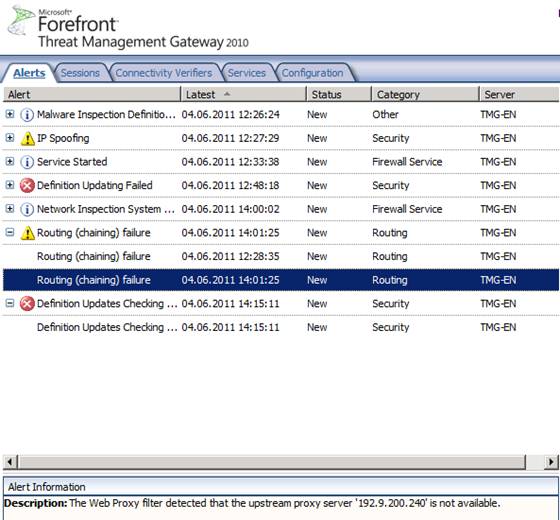
The Forefront TMG Dashboard should be one of the first places where a Forefront TMG Administrator should spend some time, because it is the central point to see the health status of your Forefront TMG Server.

From the Forefront TMG Dahsboard you can easily navigate to the Alert section, which gives you more details about the specific alerts. If you want to be informed via e-mail it is possible to create alert notifications.
Forefront TMG logging
One of the most used functionality in Forefront TMG is the TMG real time logging functionality which will give you a real time view about the traffic from your clients and Servers. The TMG logging is a wonderful tool if you want to allow network traffic from one application, Server or Client but you don’t know the required communication ports to open.

Windows Event Viewer
The next really important tool for troubleshooting TMG is the Windows Event Viewer. Forefront TMG logs alot of helpful information in the Application and System event log categories and specific information about ADAM (AD-LDS) in the Application and Services Log. The ISA Server Diagnostic Logging is empty by default, you have to activate the ISA/TMG Diagnostic logging manually, but more about this later.

TMG log files
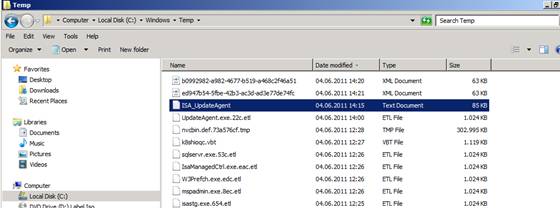
During the Forefront TMG installation, the setup process creates some log files in the %windir%\temp directory and after a successful installation you will also find some log files like the ISA_UpdateAgent log file which gives you detailed information about the TMG Web Protection platform updates.
Forefront TMG Best Practices Analyzer
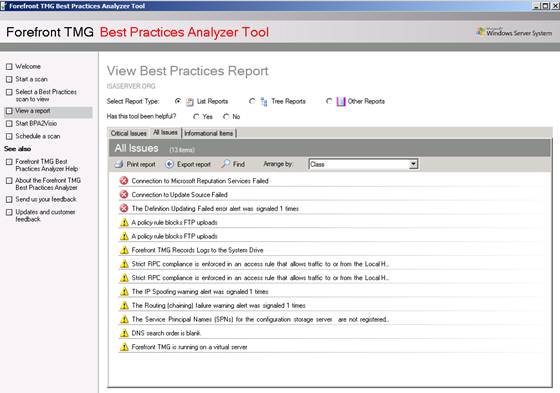
Most of you are familiar with the TMG Best Practices Analyzer which compares your current Forefront TMG installation with Best Practices from Microsoft. Using the TMG BPA should be the first tool to start after a Forefront TMG installation or when you consider problems with your TMG configuration.
Forefront TMG Data Packager
The Forefront TMG Data Packager is a very helpful tool to collect all necessary information about your Forefront TMG configuration. You can use the Data Packager to send information to Microsoft product support for further analysis but you can also use this tool to document your Forefront TMG installation status. As an TMG consultant I sometimes use the TMG Data Packager to document the TMG configuration status for my customers.

It is possible to select the options to specify the data that you would like to be part of the TMG Data Packager collection process.

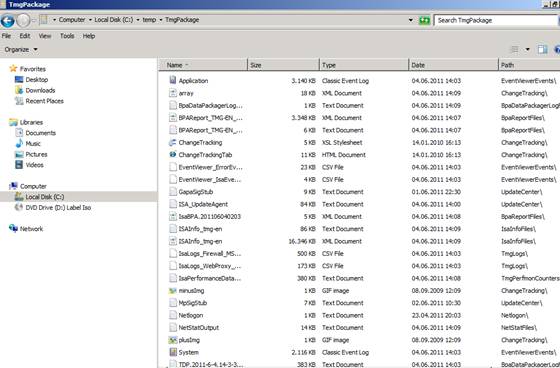
The TMG Data Packager creates a CAB file with a lot of log files as you can see in the following screenshot.
Netsh
Beginning with Forefront TMG Microsoft extended the Windows Netsh tool with some Forefront TMG commands. As some of you might know, some commands of the FWENGMON utility of ISA Server 2006 are now part of the Netsh tool. Netsh has now some options to give you a low level view about client connections with the Firewall and may be helpful in some situations.

Microsoft Network Monitor (Netmon)
As one of the last resorts in Forefront TMG troubleshooting (excepts Windows Kernel Debugging 🙂 ) you can use the Microsoft Network Monitor to get deep inside into the network traffic. Netmon may be helpful when you couldn’t find the cause of problems with the built in tools of Forefront TMG. You can use the Microsoft Network Monitor (Netmon) 3.3 version which is part of the TMG BPA installation or you can use the latest build 3.4 from the Microsoft website.

Attention:
If you want to analyze network traffic between Forefront TMG and the ISA Firewall client, now called TMG client, you have to download a special Netmon Parser. You can download the Netmon parser here.
Forefront TMG troubleshooting
The Forefront TMG Management console comes with some built in troubleshooting tools like the Traffic simulator, the change tracking feature and the connectivity test tool.

For special TMG troubleshooting the TMG Diagnostic Logging feature might be helpful to find problems with the TMG configuration. Forefront TMG Diagnostic Logging is deactivated by default and you manually have to activate it.
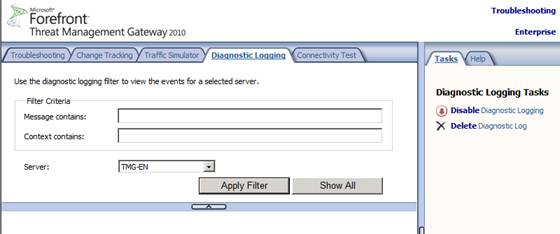
After the TMG Diagnostic logging has run for a while you can stop the Diagnostic logging and filter the log for informations that might be of interest for you.

The Diagnostic logging give you a deep insight how Forefront TMG works under the hood.
FWENGTRACE
FWENGTRACE is part of the Forefront TMG Best Practice Analyzer and can be used to modify trace information for several Forefront TMG components, in this example the Forefront TMG LLQ (Large Logging Queue) feature of Forefront TMG.

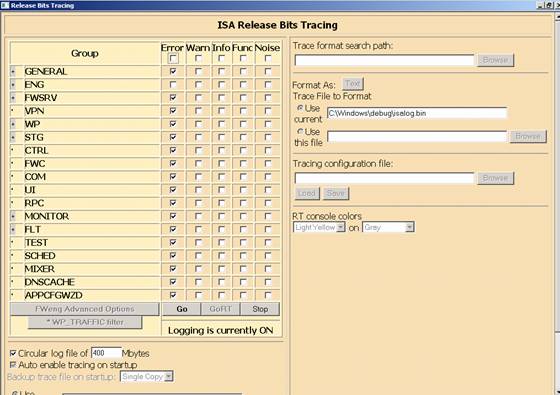
ISATRACE
Like Forefront UAG, Forefront TMG has some built in tracing capabilities, which give you the choice to modify the content of the ISALOG.BIN trace file which is located in the %windir%\Debug directory. Have you ever wondered about the large (about 400 MB) .bin file? This is the ISA/TMG trace file. Starting with ISA Server 2004 SP2 the ISALOG.BIN file is used to trace the status from a lot of Forefront TMG components. With ISATRACE you can change the information in the trace file.
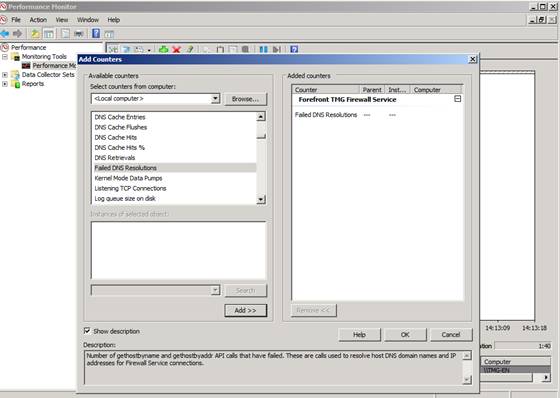
Windows Performance Monitor (Perfmon)
Perfmon is a great utility to analyze the performance of your Windows Server and the applications installed on the Server. A supported application like Forefront TMG extends the Windows Performance monitor with it’s own counters that Forefront TMG Administrators can use to built baselines of the TMG Server to compare these baselines with current loads when they expect performance problems with their TMG Server.
Because there are a lot of performance counters for various Forefront TMG subsystems and it might be time consuming for Administrator to find the right counters, Microsoft has developed PAL (Performance Analysis of Logs) which can create XML files for specific applications with helpful Performance counters. You can use these XML files to import it into the Perfmon tool.
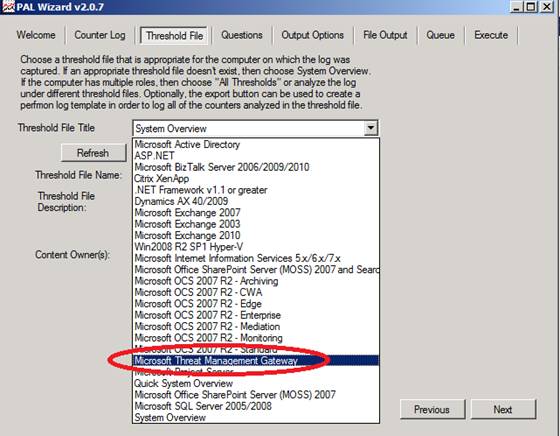
Export the XML file of PAL to a Perfmon template file. In the Windows Performance monitor navigate to the Data Collector Sets and create a new user defined Data collector set.
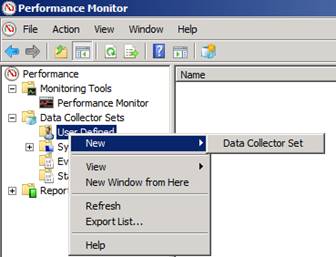
Select “Create from a template”. Select the XML template exported from PAL and now you can see the performance counters for Forefront TMG.

You can now use the user defined Data Collector Set to start collecting informations. Right click the new Data collection and select Start.
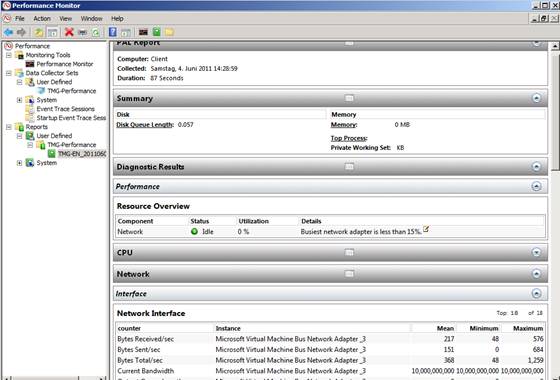
After you stop the data collection process you can view the report of the collected data under the reports section of the Windows Performance monitor.
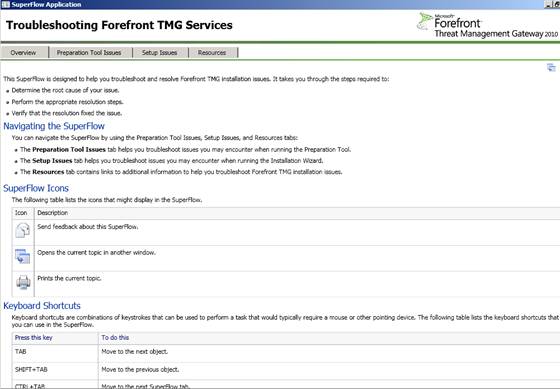
Forefront TMG SuperFlow application
This article ends with a quick overview about the Forrefront TMG Superflow application. You can use this tool to troubleshoot a failed Forefront TMG installation. TMG Superflow contains some helpful links and resources to troubleshoot a failed Forefront TMG installation. You can read more about the TMG Superflow utility here.
Conclusion
Troubleshooting Forefront TMG problems can be very complicated because of the various reasons why Forefront TMG doesn’t work as expected, but on the other hand there are lots of troubleshooting guides and tools to find the reason for the problem. In my opinion the most important aspect is to have an analytic approach when you start troubleshooting. You should always start with the easiest troubleshooting steps and walk through the other steps if the previous analytics wasn’t successful.