Introduction
When VMware’s engineers have spare time and are looking to share their “pet projects”, they do it at VMware Labs (labs.VMware.com). Over the last couple of years, VMware engineers have come up with some amazing and totally free tools for the community. Sure, some of these tools may go nowhere but others will be incorporated into future VMware products. VMware Engineers usually offer basic instructions on how to install their “fling” and provide “best effort” support via comments. I’ve talked a lot about free VMware tools from VMware labs in my best free tools webinar with Kendrick Coleman.
The most recent free tool from VMware labs is called vBenchmark. This tool measures the performance of a VMware virtualized infrastructure across three categories:
- Efficiency: for example, how much physical RAM are you saving by using virtualization?
- Operational Agility: for example, how much time do you take on average to provision a VM?
- Quality of Service: for example, how much downtime do you avoid by using availability features?
vBenchmark provides a succinct set of metrics in these categories for your VMware virtualized private cloud. Additionally, if you choose to contribute your metrics to the community repository, vBenchmark also allows you to compare your metrics against those of comparable companies in your peer group. The data you submit is anonymized and encrypted for secure transmission.
Key features of vBenchmark include:
- Retrieves metrics across one or multiple vCenter servers
- Allows inclusion or exclusion of hosts at the cluster level
- Allows you to save queries and compare over time to measure changes as your environment evolves
- Allows you to define your peer group by geographic region, industry and company size, to see how you stack up
Installing vBenchmark
vBenchmark deploys to your virtual infrastructure as a virtual appliance. Honestly, this is the best way to deploy any new application as 1) it doesn’t cost you any OS license 2) your don’t have to install any OS, application, or database and 3) you rarely have any trouble with the application as it’s pre-configured. I love virtual appliance deployments because they just “work”.
Here’s how I deployed vBenchmark in my vSphere lab, step by step…
I downloaded vBenchmark from VMware Labs, using the OVF option.

Figure 1
I extracted the 475MB ZIP file and ended up with a number of files, that you see below in Figure 2. Of greatest importance is the OVF file that defines the virtual machine and references the VMDK.

Figure 2
In my vSphere client, connected to my vCenter server, I went to File and to Deploy OVF. This brought up the “deploy OVF template” wizard. The first thing I had to do was to select the OVF from the ZIP and click Next.

Figure 3
This offered my details on the VM appliance that I was about to deploy. As you can see in Figure 4, I am deploying vBenchmark 1.0.0.0 which is 474MB in size and will take up 5GB in space if I use the thick deployment option. After reviewing, I clicked Next.

Figure 4
Then, I took the default name of vBenchmark and selected the virtual datacenter to store it in.

Figure 5
Then, I specified the cluster or host that I wanted the new to be deployed on.

Figure 6
As you see in Figure 7, I entered the network the network configuration for the new vBenchmark VM including the default gateway, DNS server, IP address, and subnet mask.

Figure 7
In the end, I had a final review of what I was about to do. After checking it out, I chose to “power on after deployment” and I clicked Next.

Figure 8
Within a couple of minutes, the deployment had completed successfully, as you see in Figure 9.
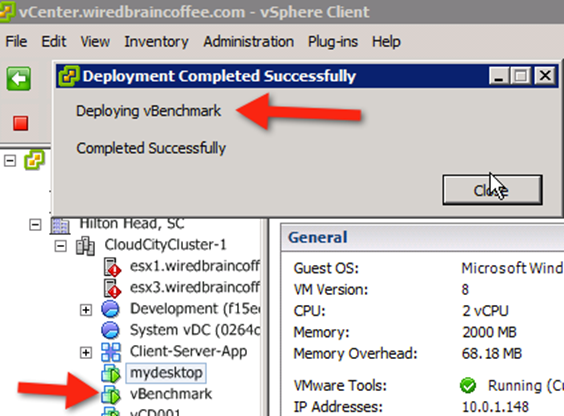
Figure 9
The vBenchmark virtual appliance is a Novell SUSE Linux Enterprise, 1 vCPU, 1.5GB of RAM virtual machine. It seemed a little strange that the VM was 32 bit (instead of 64 bit) and VM hardware version 4 (instead of 8) but I suppose it doesn’t matter because, as you’ll see below, the results are very cool.
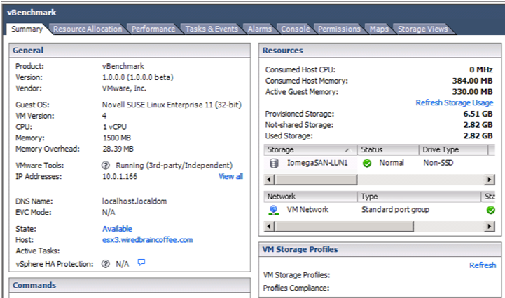
Figure 10
vBenchmark Setup
With the vBenchmark VM up and running, I pointed my web browser to the IP that I assigned during the deployment. If you used DHCP, you can see the IP for the VM on the summary page (as you see in Figure 10).
This brought up the web page that you see in Figure 11.
On this page, you enter the hostname/IP address and username/password for each of the vCenter servers in your infrastructure. If you choose, you can even upload credentials if you have multiple vCenter servers. Click Add to add the server.

Figure 11
Next, specify the number of months of task and event data that you want to retrieve from those servers. Click Initiate Query and Proceed to Dashboard.

Figure 12
Using vBenchmark
In the dashboard, you’ll really start to see the power of what vBenchmark can do.
As you can see, vBenchmark has 7 tabs:
- Dashboard
- Infrastructure Configuration
- Efficiency
- Agility
- Quality of Service
- vSphere 5 vRAM Pools
- Share
Let’s take a look at each of them.
The dashboard is really a quick summary of all the other tabs. The results shown in the graphic are from 1 month of usage in my vSphere lab so they likely don’t reflect the types of numbers you would see out of a real vSphere production infrastructure.
Here are some of the things I learned in the dashboard view:
- Average amount of servers per vCenter, CPUs per host, and GB of RAM per host (6.64 in my case)
- Average number of vCPUs per VM (1.2), Configured GB of vRAM per VM (2.58), and GB of virtual storage per VM (14.2)

Figure 13
- According to the agility report, my infrastructure seems pretty agile considering it only takes me, on average 1 minute to provision a new VM and 2 seconds to reconfigure a host or VM
- The quality of service dashboard says that, on average, I have .09 hours of host downtime, and .46 hours of application downtime, per month, AVOIDED thanks to vSphere’s features. At this point, there wasn’t enough information gathered to tell me about unplanned downtime but I look forward to reviewing that in the future (and even comparing it to others’ virtual infrastructures, something I’ll talk more about in the “sharing” section).
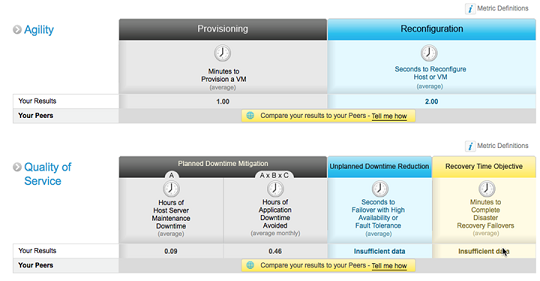
Figure 14
Moving on from the dashboard tab to the infrastructure configuration tab, this goes more into the exact details used to compute the averages. Here I can see what hosts and VMs are configured with for CPU, memory, vCPU, vRAM, and storage.

Figure 15
The efficiency tab shows me the VM density per physical CPU and physical memory utilization (I can see that host esx2 is overcommitted at 101%). I can also see the admin productivity, showing me how many VMware Admins it takes to administer the VMs in my environment. Of course, all these numbers are here to, hopefully, show us how efficient and agile our virtual infrastructure is and how that is helping our company.
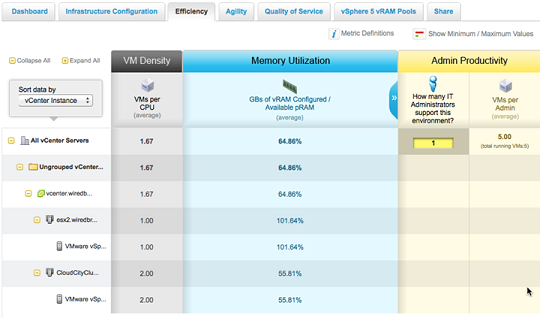
Figure 16
The agility tab breaks down the time it takes to provision and reconfigure hosts and VMs, per host and per cluster so that you can investigate how the average numbers are calculated.

Figure 17
The quality of service tab, again, breaks down the QoS numbers you saw on the dashboard into more detail, per host and per cluster.

Figure 18
As you probably know, vSphere 5 introduced vRAM maximums per licensed copy of vSphere so now it is important to monitor the vRAM utilization. vBenchmark can help you do that, as you see on the vSphere 5 vRAM Pools tab. I can see how much vRAM I am entitled to, how much I am using, and on what host it is being used.

Figure 19
Finally, on the last tab the Share tab, you can see one of the most interesting features of vBenchmark – sharing data with your peers. With this social networking feature, you can share your metrics with the VMware community and view their shared metrics. This way, you can see if you are being as efficient as your peers. You’ll have something to go by here to tell you if your stats are way off. For example, perhaps you are allocating way too much vRAM to your VMs. Or maybe, for some reason, you have more unplanned downtime than your peers (maybe you aren’t taking advantage of vMotion, svMotion, or storage DRS).

Figure 20
Summary
vBenchmark is an impressive free tool that give you a lot of “ammo” to protect and justify your VMware virtual infrastructure to the decision makers at your company. Plus, vBenchmark is super-easy to deploy and use. I applaud VMware for offering vBenchmark to us and I hope that they will include these types of features in future vSphere versions. You can download vBenchmark here.