If you would like to read the other articles in this series please go to:
If you would like to be notified when Brien Posey releases Working with Network Monitor (Part 5) please sign up to the WindowsNetworking.com Real Time Article update newsletter.
In the first part of this article series, I discussed the differences between the two versions of Network Monitor and talked about the installation process. In this article, I want to continue the discussion by showing you how to use Network Monitor.
As I explained in the previous article, there are two different versions of Network Monitor. For the purposes of this article, I will be using the full version that comes with SMS Server 2003 with Service Pack 1.
The Network Monitor Interface
When you launch Network Monitor, the first thing that you will see is a message asking you to select the network interface on which you want to capture data. This is important, because if you neglect to select an interface, then Network Monitor will pick one for you, and it might not chose the interface that you would have chosen.
Click OK, and you will be taken to a screen that is similar to the one that is shown in Figure A. Simply select the network interface that you want to use and click OK.

Figure A: You must select the network interface that you want to monitor
At this point, the Network Monitor will display the main capture screen, shown in Figure B. Before I show you how to use this screen, I just want to mention that Network Monitor only prompts you to select the network that you want to monitor the first time that you use it. If your computer only has one network adapter, then this will not be a problem. If your system is multihomed though, you will probably want to be able to monitor traffic across all of the network segments.

Figure B: This is Network Monitor’s capture screen
Unfortunately, you cannot monitor traffic across multiple segments simultaneously, but you can switch segments even though Network Monitor does not automatically prompt you for the segment that you want to monitor. To do so, simply select the Networks command from the Capture menu. Doing so will display a screen similar to the one shown in Figure A. The biggest difference between the two screens is that this screen also has a Remote option that you can use for remote packet capturing.
Having said that, let’s take a look at the capture screen. As you can see in the figure, this screen is made up of four different panes. The pane in the upper left portion of the window is known as the graph pane. The graph pane graphically displays the current level of activity during the capture process. It contains graphs that display the overall percentage of network utilization, the number of frames captured per second, the number of bytes captured per second, and the number of broadcasts and multicasts per second.
You might have noticed in the figure that there is a scroll bar associated with the graph pane. This scroll bar is deceptive because there are no graphs beyond the ones that are shown in the figure.
Just below the graph pane is the session statistics pane. The session statistics pane is designed to display a quick summary of the traffic that has been captured. This section displays things like the network addresses of the hosts involved in a conversation, and which host initiated the conversation.
The bottom section of the screen contains the session statistics pane. This pane displays capture summary information on a per host basis. The network address of each host is displayed along with the number of frames sent and received, bytes sent and received, and the number of directed frames, multicasts, and broadcasts sent.
The upper right section of the window contains the total statistics pane. As the name implies, this pane displays statistics related to all of the traffic that has been captured as a whole. This pane displays the same types of information as the other panes that I have mentioned. The difference is that the total statistics pane does not break the statistics down on a per host basis.
Capturing Network Traffic
Now that I have given you a quick orientation of the Network Monitor interface, it is time to capture some network traffic. If you look at Figure B, you will notice the tool bar just above the graph pane. This toolbar is used to control the capture process. The capture related buttons on the toolbar are as follows:
 Capture Data
 Pause the capture or resume a paused capture
 Stop the capture process
 Stop the capture and view the captured data
 View the captured data
 Help
Help
To capture data using the Network Monitor, just click the Capture Data button. Network Monitor will begin capturing data and will not stop until you either pause or stop the capture. The data capture process looks something like the what you see in Figure C.
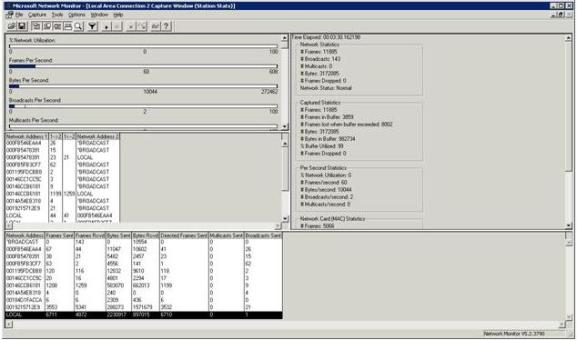
Figure C: This is what the Network Monitor interface looks like while data is being captured
As you look at the figure, the first thing that you will probably notice is that it contains lots of statistics, but no real data. If you want to view the data that has been captured, you will have to click the View Data button on the toolbar. Upon doing so, you will see a screen similar to the one that is shown in Figure D.

Figure D: This is what the captured data looks like (click here for larger image)
If you look closely at the captured data you will notice that what Network Monitor is really displaying is a summary of the individual frames that have been captured. This particular screen lists the frame number, the time that the frame was captured, the source and destination addresses, the protocols used, and things like that, but it does not actually show the data contained within the frame. Fortunately, there is an easy way to view more detailed information.
If you look at the toolbar, you will notice three buttons that consist of three rectangles each, as follows

These buttons allow you to toggle the summary pane, details pane, and hexadecimal pane. When all three panes are enabled, you can see a comprehensive view of the selected frame, as shown in Figure E.

Figure E: The three pane view gives you comprehensive information regarding the currently selected frame (click here for larger image)
As you can see in the figure, the Details pane displays protocol information for the currently selected frame. When a frame contains multiple protocols, the outermost protocol is listed first. The hexadecimal pane displays the actual data that makes up the frame. Notice in the figure that a portion of the frame is selected in the Details pane. The selected portion is then highlighted in the Hexadecimal pane to help you isolate the data.
Conclusion
In this article, I have discussed the basics of using Network Monitor. In Part 3, I will walk you through a sample capture and teach you how to analyze the captured data.
If you would like to read the other articles in this series please go to:
If you would like to be notified when Brien Posey releases Working with Network Monitor (Part 5) please sign up to the WindowsNetworking.com Real Time Article update newsletter.