Amazon Simple Storage Services, popularly known as Amazon S3, is an object storage system with a simple web interface that makes it easy to store and retrieve any amount of data from the cloud. It comes with a host of features and add-ons that make it a breeze to handle vast amounts of data across the world.
In Amazon S3, data is stored in the form of objects, and in turn, these objects are stored in resources called buckets. You can imagine this to be a real bucket that holds stones of different sizes, where you have the flexibility to add stones until the bucket’s capacity is reached and remove them at any time you want. In this analogy, stones are nothing but groups of data in the real world while buckets are imaginary structures.
This simple storage structure adds to its popularity and some of the other reasons are that it is:
- Simple to use
- Secure
- Reliable
- Available across many regions
- Easy to integrate with a host of apps and services
- Highly scalable
- A tool to leverage the power of cloud
These benefits have led to its widespread adoption among companies of all sizes worldwide.
But over the years, companies have been finding it hard to keep track of their buckets and cloud budgets, especially as they migrate more data and applications and want to make the most of the power of the cloud.
To overcome this roadblock, Amazon has come up with a new product called the Amazon S3 Storage Lens.
What is Amazon S3 Storage Lens?
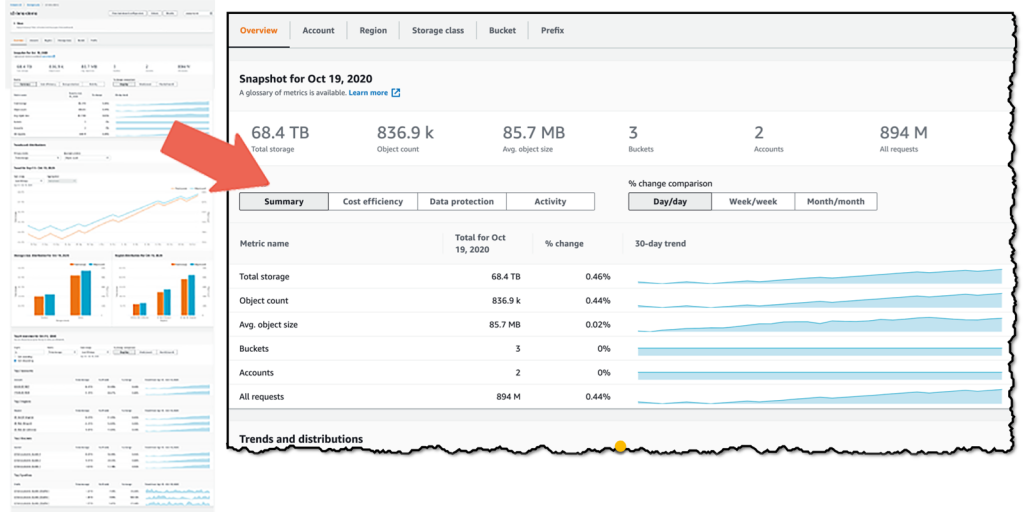
Simply put, Amazon S3 Storage Lens gives a single view of your Amazon S3 storage use and activity across all units and regions. It gives a concise idea of how much storage space you use, the regions across which they are spread, add-ons and their usage levels, and just about everything else you want to know about your Amazon S3 account.
Another salient aspect is that it generates insights about your usage, so you can get actionable intelligence for making appropriate decisions and to incorporate best practices.
These insights are presented through an interactive dashboard on the Amazon S3 console for your quick perusal. It can also be downloaded as a CSV file for further analysis.
Now that you have a good idea of what Amazon Storage Lens is all about, let’s talk about how you can set it up, what the different metrics are, and how you can use it.
Setting up AWS S3 Storage Lens
As a first step, go to your S3 console and activate the S3 Storage Lens.
An S3 dashboard is automatically created for every customer and is called the “default-account-dashboard.” This contains the summarized insights and trends of your Amazon account storage and usage. These metrics are updated daily, so what you see will be the most recent activity until the previous day.
You can’t delete this default dashboard, but you have the option to upgrade from the free to the paid membership to get more detailed metrics and advanced recommendations. However, you can disable the default dashboard, and when you do this, it is no longer updated with the latest information.
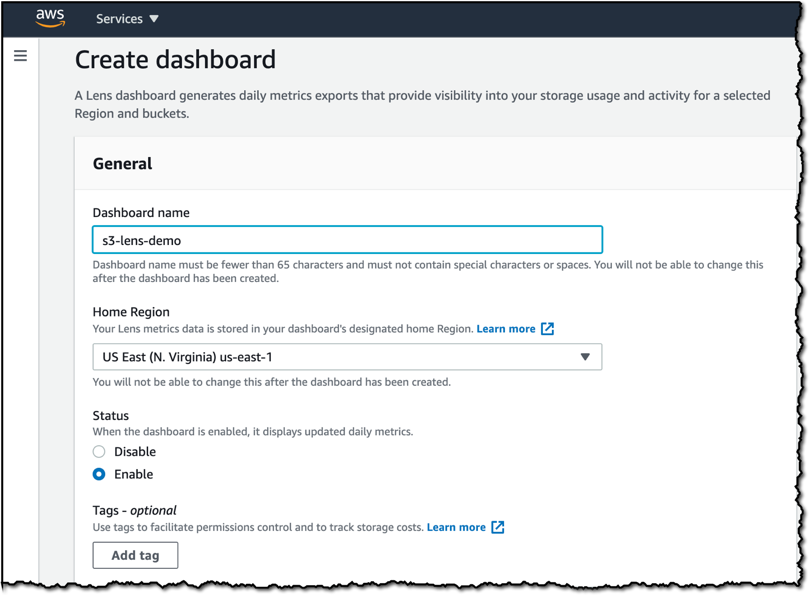
You must also set the home region as this is where all the metrics for a given dashboard or configuration are stored. Note, you can’t change the home region associated with the Amazon account, so double-check before creating it.
Also, this home region feature is not available for the following regions:
- Africa Cape Town (af-south-1)
- Asia Pacific Hong Kong (ap-east-1)
- Europe Milan (eu-south-1)
- Middle East Bahrain (me-south-1)
Overall, the configuration and setup are fairly intuitive and the navigation is easy.
Custom dashboards
Free accounts come only with the default dashboard, but paid memberships offer more flexibility as you can create custom dashboards.
Here are some things you can do with a paid membership.
Create a max of 50 dashboards
Paid memberships allow you to create up to 50 custom dashboards per home region. You can choose to have dashboards that depict the activity of the entire organization or just a specific region or bucket, and you have complete control over the metrics you want in it.
Note that organization-level dashboards have only a regional scope.
Historical data
You can access historical data for a maximum of the last 15 months. On the dashboard, you can see the summary, the cost efficiency of your usage, data protection, and activity. With this information, you can determine how your usage has grown or shrunk over a specific period so that you can act on it.
But when you delete dashboards, you lose the historical data that it houses, and to retrieve this data, you must create a new dashboard with the same name and in the same home region!
Working on the metrics
A key aspect of Storage Lens is the metrics, as it tells you all that you want to know, such as usage levels, cost-effectiveness, and more.
Deeper analysis
Amazon S3 Storage Lens allows you to select the primary and secondary metrics from the given list for deeper analysis. You can choose from a wide range of metrics to meet your specific needs.
Export metrics
If you already have an analysis system in place, you can simply download the metrics in a CSV or Parquet format and integrate it with your in-house system for integrated analysis.

However, your metrics must be in the region mentioned in the Storage Lens configuration. You can always edit your configuration in the Storage Lens dashboard or through AWS CLI and SDKs.
Metric types
So, what metrics do you get?
Broadly speaking, the metrics are divided into usage and activity.
Usage metrics
The usage metrics give the size and volume of your storage and includes information such as,
- Total bytes stored.
- The average size and number of objects.
- Number of active buckets and accounts.
- Percentage and number of bytes and objects that are in the current version.
- Count and percentage of bytes and objects that don’t belong to the current version.
- Number and percentage of objects with a delete marker.
- The total number and percentage of encrypted bytes and objects.
- Number and percentage of unencrypted bytes and objects.
- Percentage and number of replicated bytes and objects.
- Number and percentage of bytes and objects with an Object Lock enabled.
- The total bytes and objects with incomplete multipart uploads and their respective percentages.
All these metrics are available in both the free and paid versions, and the difference is that the retention period is 14 days for the free version and 15 months for the paid version.
Activity metrics
The activity metrics are a part of the advanced plan and are available only for paid members. They give information on the frequency of access and uploads.
Some of the information it includes are:
- The number and percentage of GET, PUT, Head, Delete, Post, and Select requests.
- Number of scanned, returned, and downloaded bytes.
- Percentage of retrieval rate.
- Ingest ratio, which is the number of bytes loaded as a percentage of total storage bytes.
- Total 4xx and 5xx errors and the percentage of these errors to the total requests.
These metrics are sure to give the insights you need for decision-making and recalibration of your short-term and long-term goals and budgets.
Recommendations and suggestions
If you’ve subscribed to the advanced plan, you also get recommendations and suggestions based on your usage and activity. The highlight is that each recommendation is placed right next to the metric on which it is based to make it easy for you to relate.
Note that recommendations are not available for historical data because recommendations are relevant only for the current data and not for the past. Also, there is no recommendation for every metric, and it is available only when it is relevant.
These recommendations come in the form of suggestions and callouts.
Suggestions
Suggestions are based on your usage and activity trends and aim to give you a cost optimization idea or a best practice for data usage and protection. Based on the suggestion, you can also drill down through the metrics to compare them to other regions or buckets, as the case may be.
Call-outs
Call-outs are intended to bring your attention to some anomaly in your usage and activity, so you can correct or monitor it. This can be a sudden change in activity, costs, and more, and is displayed typically when they are in the range of +/- 20 percent.
These call-outs are based on a 30-day trend, so they are relevant and not just a temporary spurt or fall. At the same time, they don’t necessarily have to indicate a problem, as this could reflect some things you did to better align storage with your business needs.
So, take call-outs seriously and see what it’s all about, but there’s no need to panic.
Amazon S3 Storage Lens: A tool for better insights
In all, Amazon S3 Storage Lens is a handy service that gives detailed insights into your S3 storage and activities in a central place. Its customization and recommendations are sure to improve the quality of your decisions and align it with your business goals and budgets.
Have you tried it? What’s your take on it?
Featured image: Pixabay