Introduction
Microsoft has made significant changes to the network interfaces and underlying functionality in each of the last few Windows releases. You still have all the usual tools (ipconfig, ping, nslookup, etc), but Windows 7 and Windows Server 2008 R2 adds additional troubleshooting features and tools for both the end-users and administrators.
Starting with Windows Vista, Microsoft includes the Network Diagnostics Framework (NDF). It provides for more advanced troubleshooting functionality than in previous versions of Windows. It includes tools that automate the troubleshooting and fixing of some of the common network connectivity issues. It also provides additional troubleshooting tools to end-users and more access to third-party applications.
In Windows 7 and Windows Server 2008 R2, Microsoft better integrated NDF into Windows. There’s quick access via the notification area and prompts after an issue has been detected. There’s also a new Troubleshooting area in the Control Panel and network tracing via Event Tracing for Windows (ETW).
General Network Troubleshooting
If Windows doesn’t automatically detect an issue, you can manually access the general troubleshooting wizard by either:
- Right-clicking the network icon in the notification area and selecting Troubleshoot problems, such as seen in Figure 1.

Figure 1: Accessing the general troubleshooting wizard via the system tray.
- Clicking the Diagnose Connection Problems button (see Figure 2) in Internet Explorer, which is displayed due to Internet connectivity issues.

Figure 2: Accessing the general troubleshooting wizard via Internet Explorer.
Either way will start the Windows Network Diagnostics wizard, which will run a couple tests to see if it can detect the problem. It checks things such as web connectivity, name resolution, gateway configuration, remote host, and network adapter. It will try to automatically fix it or give you recommendations.
If it doesn’t detect anything specific, you’ll see something similar to Figure 3, saying it couldn’t identify the problem.
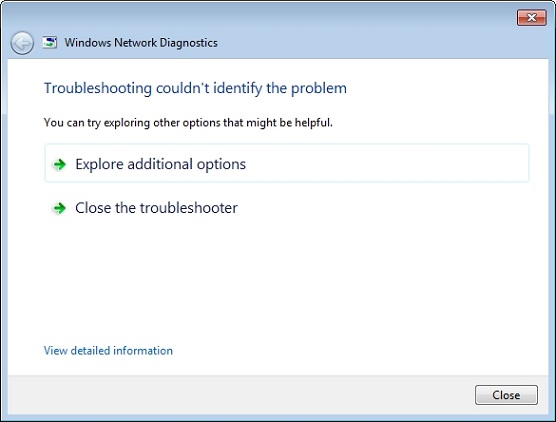
Figure 3: When the troubleshooting wizard can’t pinpoint the issue.
You should always click the View detailed information link for additional info and to obtain the Event Tracing Log (ETL) file that can be given to an administrator for further troubleshooting. Figure 4 shows an example of what is shown when a user is successfully connected to the local network but the Internet can’t be reached—I unplugged the router from the modem.

Figure 4: Example of the troubleshooting report details.
In this situation, it lets you know there’s a connection issue between your access point, router, or modem. This should then prompt you to check the physical connections and Internet connection status. Also as suggested, you may try restarting the modem.
Clicking Next takes you back to the previous window, where you can click Explore additional options for a list of shortcuts, as shown in Figure 5, which may lead to some help.

Figure 5: Example of additional information options after troubleshooting.
Troubleshooting Specific Issues
Windows also provides troubleshooting wizards designed for specific issues:
- Internet Connections: Tests against microsoft.com or a site of your choice.
- Shared Folders: Tests connection to a specific network share.
- HomeGroup: Helps you create, join, and share in a HomeGroup.
- Network Adapter: Helps detect network adapter issues.
- Incoming Connections: Troubleshoots issues with the Firewall and incoming connections.
You can access these wizards by:
- Clicking the Troubleshoot problems link (see Figure 6) in the Network and Sharing Center.

Figure 6: Accessing the troubleshooting center via the Network and Sharing Center.
- Clicking Start > Control Panel > Find and fix problems (see Figure7) > Network and Internet.

Figure 7: Accessing the troubleshooting center via the Control Panel.
These wizards require some type of input, such as specifying a site, shared folder, etc. Once completed, you’ll see similar results as with the general wizard: the issues might be automatically fixed, you may receive additional recommendations, or nothing may be detected and you can view the detailed information and access Event Tracing Log (ETL) file.
Viewing Troubleshooting History
Each troubleshooting session is recorded and saved by the wizard. To see the troubleshooting history, click Start > Control Panel > Find and fix problems, and then click the View history link on the left of the main Troubleshooting window.
You’ll see an entry for each troubleshooting session, such as shown in Figure 8.

Figure 8: Viewing the troubleshooting history.
Opening a session will display the same info given when clicking the View detailed information link after you ran the wizard. Plus the Event Tracing Log (ETL) file can be accessed and then forwarded to the IT department.
Exporting the Event Tracing Log (ETL) and Troubleshooting Details
You can view and analyze the ETL files with Network Monitor. You can also view the files with Event Viewer and the Tracerpt.exe tool. Plus you can convert them to XML or text files with the netsh trace convert command.
You can also extract the details and ETL files of troubleshooting sessions to CAB files by right-clicking the session in the Troubleshooting History window and then selecting Save As. Then it can be sent to the IT department for analysis.
Performing Network Tracing and Diagnostics
Windows 7 and Windows Server 2008 R2 includes new Netsh commands to perform network tracing and diagnostics. You can use the tracing feature to collect and create a report on the network component details and network traffic at the same time. You can use the diagnostic feature to see if Windows can detect and fix the issue, or give you additional info that can help.
Tracing can be executed using different trace providers (such as Winsock, TCP/IP, wireless LAN services, or NDIS) to capture and show information for each different component. Alternatively, you can choose a scenario (such as File Sharing, DirectAccess, or Network Connections) which you are trying to troubleshoot and it will use a predefined set of providers, conveniently giving you the information you need.
To get started, bring up a Command Prompt, and then to see a list of all providers:
netsh trace show providers
To see a list of available network-related scenarios:
netsh trace show scenarios
To see the details of a scenario, including the list of providers used and the attributes used for the diagnose command:
netsh trace show scenario scenario_name
Here’s how to start tracing for a particular scenario:
netsh trace start scenario= scenario_name
Here’s an example of how to perform tracing on multiple scenarios:
netsh trace start scenario= scenario_name scenario= scenario_name scenario= scenario_name
Here are parameters you may want to also define when starting a trace:
- capture = { yes | no }: When set to “no”, or not defined, network packets aren’t included with the trace info. To capture the network packets too, put capture = yes.
- Report = { yes | no }: Specifies if a report should be complied along with the trace info.
- persistent = { yes | no }: When set to “no”, or not defined, tracing stops after the PC is restarted, or the stop trace command is issues. To keep the tracing session active after restarts and until manually stopped, put persistent = yes.
- Overwrite = { yes | no }: Specifies if any previous trace file should be overwritten. Since it by default overwrites previous files, you may want to put overwrite=no in case. Then if it says the file exists, you can specify a different location using the next parameter.
- traceFile = “path\NetTrace.etl”: Specfies where to save output files to. By default its C:\Users\username\AppData\Local\Temp\NetTraces.
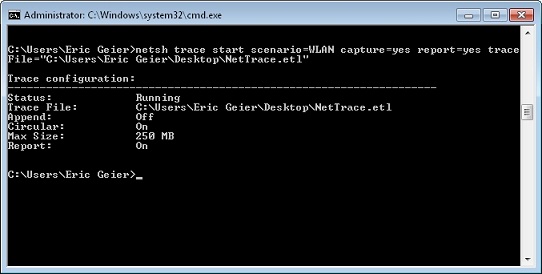
Figure 9: Example of starting a tracing session to troubleshoot wireless LAN issues, with packet capturing and reporting on, outputting to my desktop.
To stop tracing, simply enter:
netsh trace stop
To add an extra provider to a scenario:
netsh trace start scenario= scenario_name provider= provider_name
To see all of the options and filters available you can type:
netsh trace start /?
Here’s the command and parameters to run diagnostics:
netsh trace diagnose
- scenario = ScenarioName (Required)
- namedAttribute = AttributeValue (Required)
- saveSessionTrace = { yes | no }
- report = { yes | no }
- capture = { yes | no }

Figure 10: Example of running a FileSharing diagnosis to see why the LAPTOP computer isn’t accessible.
Summary
We discovered the Windows Network Diagnostics wizard that can help solve general networking problems, especially useful for end-users. This wizard is accessible by right-clicking the network icon in notification area or on the error page in Internet Explorer. We also found troubleshooting wizards for a couple specific issues, accessible via the Control Panel or by clicking the Troubleshoot problems link in the Network and Sharing Center
We then discovered the netsh trace commands administrators can use to perform tracing and diagnosis at the command-line. After finding an appropriate scenario, you can start a tracing session, optionally choosing to capture the network packets and creating a report. For a diagnosis, you first need to choose a scenario and then view the scenario details to find the attributes you can include with the diagnose command.