If you would like to read the other parts in this article series please go to:
- Strategies for Monitoring Failover Clusters (Part 1)
- Strategies for Monitoring Failover Clusters (Part 2)
- Strategies for Monitoring Failover Clusters (Part 4)
- Strategies for Monitoring Failover Clusters (Part 5)
- Strategies for Monitoring Failover Clusters (Part 6)
Introduction
If you have been following the instructions in the first two parts of this article series, then you have deployed the required agents to your cluster servers, but there is a good chance that the cluster nodes are not yet being monitored. That being the case, it is important to take a moment right now to determine whether or not the agents are currently functional.
The easiest way to check the status of your agents is to open the System Center Operations Manager console, select the Administration tab, and then choose the Pending Management container in the console tree. If you look at Figure A, you can see that the agents that I deployed to my cluster nodes are still pending management.

Figure A: If the agents are pending management then your servers are not being monitored.
Let me just say up front that there are countless problems that can result in agents being stuck in the Pending Management container. Therefore, I want to spend some time talking about agent troubleshooting.
Before I Begin
Before I get started, I want to point out that I am assuming that the agents were successfully deployed to the cluster nodes that you want to monitor. When you performed the steps outlined in Part 2 of this series, you should have seen a confirmation message indicating that the agents were deployed successfully. If you did not receive this message then you have some work to do before you even begin troubleshooting agent communications problems.
Fixing Agent Installation Issues
If you have had trouble getting the agents to deploy correctly, then go to the screen shown in Figure A, right click on the agents, and choose the Reject command from the shortcut menu. This is akin to aborting the agent installation process.
Before you attempt to install the agents again, it is a good idea to run a cleanup script on the servers that you are monitoring. Doing so gets rid of any old agent remnants and anything else that might prevent the agents from being installed successfully.
You can perform the clean up by using a free tool from the SCOM resource kit called CLEANMOM. You can download this tool here. It is worth noting that this tool is specific to SCOM 2007 R2. Older versions of the tool will not work if you are using the R2 release.
CLEANMOM is a command line tool, as shown in Figure B. To use it, open the correct version of the tool (X86 or X64) and then execute the following two commands:
Cleanmom /CleanAgents
Cleanmom /CleanServers
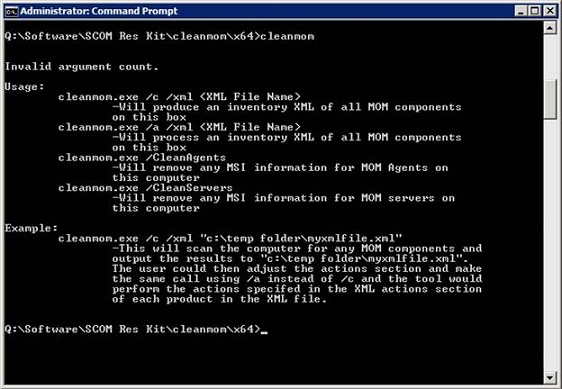
Figure B: Cleanmom is a command line tool used for correcting agent deployment issues.
Agent Troubleshooting
Once you have verified that your agents have been successfully deployed, it is time to begin the troubleshooting process. The best place to begin this process is in the event logs on a server that you are attempting to monitor.
The Event Logs
If you open the Event Viewer on a server that you are attempting to monitor, you will see that there is a special collection of event log entries geared specifically toward System Center Operations Manager. You can find these log entries by browsing through the Event Viewer console to Application and Services Logs | Microsoft | Operations Manager, as shown in Figure C.
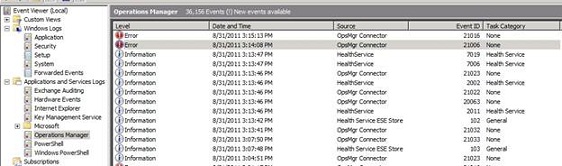
Figure C: The Event Viewer contains a SCOM specific log.
As you look at the you can see that the agent provides granular monitoring information that steps you through each part of the installation and monitoring process. As such, you can work through the event log entries to see exactly where the process has broken down.
In my particular case, I received two error messages. The first error message was tied to Event ID 21006. The event details said:
The OpsMgr Connector could not connect to SCOM.production.com:5723. The error code is 10060L (A connection attempt failed because the connected party did not properly respond after a period of time, or established connection failed because connected host has failed to respond). Please verify there is network connectivity, the server is running and has registered its listening port, and there are no firewalls blocking traffic to the destination.
This event was immediately followed by Event ID 21016. The details for this event state:
OpsMgr was unable to set up a communications channel to SCOM.production.com and there are no failover hosts. Communication will resume when SCOM.production.com is available and communication from this computer is allowed.
These two events collectively indicate that the agent has been successfully installed and is working properly. However, the agent is attempting to talk to the SCOM server, but a problem is preventing communications between the agent and SCOM.
Agent Authorization
The details for the second event are a bit misleading. They seem to hint that the problem is that the agent has not been authorized to communicate with SCOM. However, agents must only be authorized if the agent was manually deployed. Otherwise the agent is automatically authorized.
SCOM Gateway Issues
If you do an Internet search on these two events, you will find that the most common problems revolve around the use of a SCOM gateway server. Gateway servers are used when resources outside of the current domain need to be monitored. In these types of situations most agent communications problems can be tracked down to improper use of certificates. However, for the sake of this article series I wanted to keep things as simple as I could, so the techniques that I have provided so far are based on a single server SCOM deployment. This deployment uses a self-signed certificate and no gateway server. As such a certificate mismatch is not the issue (at least not if you are following my instructions).
Possible Problems
There are three main factors that can cause the types of errors discussed earlier. These errors can be traced to network configuration issues, firewall problems, and Kerberos problems.
Kerberos Problems
If you look up SCOM Kerberos problems on the Internet, almost all of the results that you will receive relate to the gateway certificate issue that I mentioned earlier. However, Kerberos problems can also occur within a domain if the server clocks are not kept in sync. Therefore, the first thing that I recommend doing is making sure that the clocks on your monitored servers, domain controllers, and SCOM server are all synchronized within plus or minus five minutes of one another.
Firewall Problems
The most common cause of agent communication problems within a domain is an improperly configured firewall. If you look at the first event that I mentioned earlier, it specifically indicates which port the agent is trying to use to communicate with the SCOM server. You must make sure that this port is open on both the SCOM server and on the server that is being monitored.
Network Problems
One more common cause of the errors that I referenced above is network problems. It’s easy to blow off network errors as a potential cause, because most of the time if there is an underlying communications problem then you would know it. However, sometimes a simple PING test can be very revealing.
If you look at Figure D, you can see that when I pinged my SCOM server from the server that was being monitored, the PING failed. This can happen if the firewall is blocking ICMP traffic, but in my case the firewall was completely disabled (for testing purposes) on both servers.
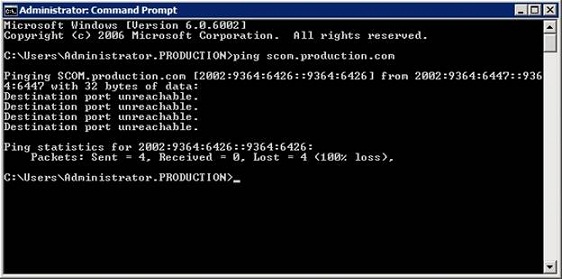
Figure D: Try pinging the SCOM server from the server that you are trying to manage.
The reason why the PING failed has to do with the history of this article series. When I wrote Part 1, I set up a virtual server on which to run SCOM and then joined that server to my domain. A few weeks later I ended up getting a new lab server. Rather than bothering with the hassle of migrating all of my virtual machines, I simply recreated the ones that I needed. The problem was that my SCOM server was the only VM on that entire server that was joined to my production domain.
Since I had blown away my SCOM server I rebuilt it prior to writing Part 2 of this series. I had no trouble joining the server to my domain or installing SCOM, but I did make one mistake. I used exactly the same server name as what I had used previously.
When I joined the new SCOM server to my domain, I went into Active Directory Users and Computers and reset the computer account so that I could reuse it. What I failed to do however, was to check the DNS entry for the server. The new server used a different IP address than the old server, and the DNS entry for my SCOM server still used the old IP address. That is why the PING test failed.
I was able to correct the problem by correcting the DNS entry and then restarting the System Center Management service on the server that I was attempting to monitor. As you can see in Figure E, all of the servers are now reported to be in a healthy state.
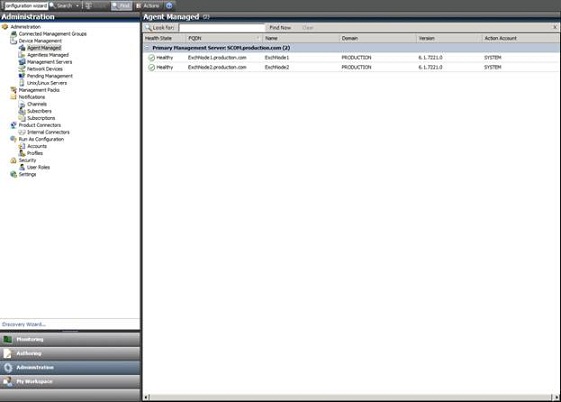
Figure E: The problem has been corrected and the servers are ready to be monitored.
Conclusion
Sometimes getting the agents to cooperate can prove to be a big task. Hopefully however your agents are working and you are ready to start monitoring your failover cluster. I will show you how in Part 4.
If you would like to read the other parts in this article series please go to: