Product: eG VM Monitor
Product Homepage: www.eginnovations.com
Evaluation Version Application: click here

Introduction
With the use of virtualization growing and growing, the performance of virtualized environments becomes more and more critical. In reality, as soon as you migrate the first business critical application into a virtualized environment, the performance of that application & environment is immediately critical. While VMware ESX may have some decent performance utilities built in, the visibility of those tools is limited. As system/virtualization admins, what we need is a performance monitoring tool that can tell us very quickly where the root cause of a problem is and, even better, remediate that problem for us. After careful review of eG’s VM Monitor, it may be the best tool for the job.
 I have been impressed with eG VM Monitor since I was a judge of the best products of VMworld 2008 in Las Vegas – new technologies category. While I did not judge the category that eG VM Monitor was in, I did meet with other judges and listened to them justify why they felt that VM Monitor was the best management tool for the VMware Infrastructure Suite. Quickly thereafter, they selected the eG VM Monitor as the best infrastructure management tool of VMworld 2008 out of a group of 30 competing products. Later in the show, I visited the eG’s booth to see the product in action. I am glad that, in performing this review, I have had more time to install, use, and test eG VM Monitor for myself.
What can the eG VM Monitor do for you?
Let’s face it, most business enterprise applications today are multi-tiered. That means that they depend on multiple applications, servers and, now, virtual servers to function. For example, if you are using an ERP application, it may count on the network, a web server, an app server, a database, a Citrix front end, and now a VMware ESX host to function. So, if a user says that their virtual desktop running this ERP application is slow, where is the issue?
As a system admin, you then have 7+ areas to look into (and I could even add more like a SAN). What you need is a system that can monitor all of these different tiers and tell you immediately which piece is the true root cause of the problem. To put it simply, this is the reason that you need the eG VM Monitor.
Here are some of the many features of eG VM Monitor:
-
Completely web-based.
-
Extremely configurable.
-
Auto discovery of servers, networks and applications.
-
Options for agent-based or agent-less monitoring.
-
Simple licensing – single-agent licensing for all servers monitored.
-
Daily, weekly, and monthly automatic trending of statistics.
-
Personalized views and alarms.
-
Integration with trouble ticket tracking systems like Remedy.
-
Customizable alarms to send email, SMS, and SNMP traps.
-
Detailed real-time and historical graphing and reporting.
-
Layered modeling for clear problem determination.
-
Complete internal and external monitoring of network, systems, and applications. This includes system monitoring, process/service monitoring, network traffic, external web/email/ftp/dns/ldap monitoring, and application monitoring. The list of applications monitored out of the box using eG’s standard layered modeling approach is one of the longest I have seen (more than 85 different applications). The list includes IIS, SQL, Oracle, Exchange, .NET, DNS, firewalls, load balancers, backup servers, VMware ESX hosts, and Citrix servers.
-
And, my favorite feature of all – automatic triage using application inter-dependencies to determine root cause analysis of problems, independent of infrastructure silos.
Because of features like these, you can:
- Create views based on job or on an area to delegate responsibilities.
- Manage all pieces of the infrastructure involved in supporting a single application.
- Look at infrastructure by how it affects business units (applications and their associated infrastructure can be grouped together as a business service).
- Visualize all the components, by layer, and how they are connected.
- Measure application response time, such as the time to login, time to checkout, or time to browse an electronic catalog.
- And again, my favorite – quickly determine the root cause of a problem.
How did I Review the eG VM Monitor?
To learn about the eG VM Monitor, I didn’t just read about it or watch a webinar. Here is what I did:
-
To get started, I watched a demo video about eG VM Monitor on the eG website. It goes through what makes eG VM Monitor unique, and how it can help you get to the root cause of a problem in a multi-tiered environment. You can watch the demo here.
-
I used the eG Innovations hosted version of eG VM Monitor, which allowed me to use the product to monitor a variety of different applications and services, such as Citrix, IIS, SQL, Terminal Services, ESX, a VDI host, and Windows File Services. (You can contact eG’s sales team to gain access to this environment).
-
Finally, I installed eG VM Monitor on my own home lab, configured it to monitor a VMware ESX & Windows 2008 Server, and took it through its paces. On eG’s website, you can fill out a demo evaluation form to try out VM Monitor for yourself.
What does the eG VM Monitor look like and how can it help me?
To use the eG VM Monitor, you open your web browser and point it to the http://yourvmmonitorserver:7077 (the port used is configurable). You log in with your username and password (or the default username and password of admin/admin).
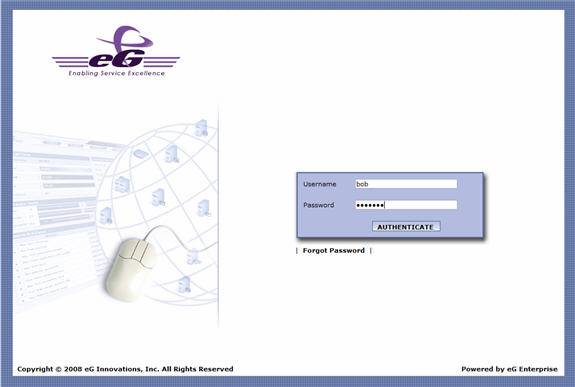
Figure 1: Logging into eG VM Monitor
Notice how I logged in with the username bob. eG VM Monitor allows you to create different roles for different users. For example, you could have a SQL Server admin who monitors only the SQL Server farm. Or, you could have a regional IT manager manage only the servers in specific regions.
As soon as you log in, you will likely see the alarms window. Do not be “alarmed” (I could not resist) because this is going to tell you, very quickly, what you need to take care of. You can think of it more as the “heads up” window.

Figure 2: Alarms Window upon logging in
Think about it, wouldn’t you rather be presented with the one single “fire” that you need to put out when you walk through the door instead of spending an hour sorting through email to find the one thing that you really needed to do an hour ago? That is what the alarms window provides. Even better, it does not give you 1,000 alarms to sort through. The red item at the top of the alarms window is very likely the root cause of all or many of the alarms in the window. Thus, eG VM Monitor is telling you that you need to handle that root cause first and it likely will resolve the others.
For example, in Figure 2, you see that the top red alarm indicates that physical CPU usage is high on that ESX host system. That is what is causing the run queue high (second alarm) and the slow response on the IIS and SQL Servers when you go to the last two errors.
Compare these scenarios:
Scenario 1 – You get a call from 10 end users complaining that their PCs are running slow.
- You check the network and their desktop CPU utilization and find nothing.
- You check the DNS Server and Citrix servers and find nothing. Their primary application is a web-based Intranet application run in Citrix.
- You run that application yourself and find it to be slow.
- You check the virtual guest server it is running on and find it is running slow.
- You check the ESX host server and find that it has a high run queue.
- Finally, you check the CPU on the host and find that there is a backup running on the service console slowing it all down. After killing the backup process in the ESX service console, normal performance resumes and you call back the 10 users to let them know that you have resolved the problem.
Scenario 2 – You get an email from eG VM Monitor that ESX host 5 has high CPU utilization. You log in to eG VM Monitor, click on the alarm, drill down to the process taking that CPU and kill it before the end users had a chance to call.
How long did scenario 1 take? Perhaps 2 hours. How long did scenario 2 take? Perhaps 10 minutes. Which do you prefer?
What do eG VM Monitor Reporting and Monitoring features offer?
In Figure 3 below, you can see what the typical eG VM Monitor window looks like.
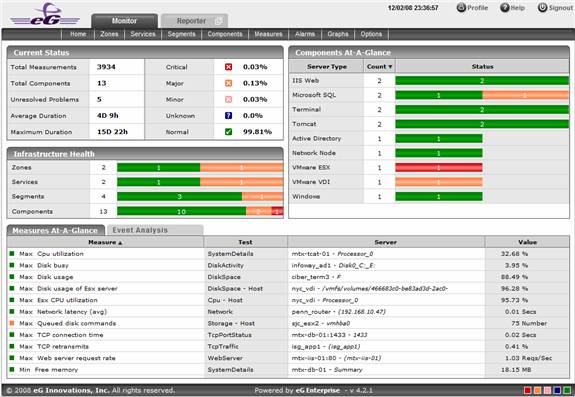
Figure 3: The typical eG VM Monitor Screen
The two tabs on the top allow you to monitor and report. The data in the Reporting tab is amazing, eG VM Monitor’s Reporter feature analyzes thousands of metrics collected by the eG suite. Those metrics are then used so that Reporter can offer trending, capacity planning, problem diagnosis, or service level audits. With the information provided by Reporter, you are able to determine how efficient the network is, where a bottleneck is located, what is slowing down your servers, and what you should do to prepare for capacity needs in the future.
Now let’s focus in on what the Monitor tab can do for you. In the Monitoring tab, you will find:
-
Current Status – showing you what percentage of your measurements are at critical alarm state.
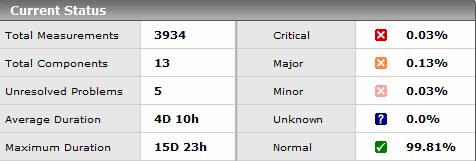
Figure 4: Current Status
- Components at-a-glance – shows your different types of servers and what number of them has alarms. Notice that of our two IIS Web Servers, both of them are alarmed.

Figure 5: Components-at-a-glance
-
Measurements at-a-glance – shows what measurements (statistics) we are collecting from our servers and applications, and which of those have the highest alarms (e.g., are out of their normal range).

Figure 6: Measurements-at a-glance
If I click on any of the above servers (components) or measurements, I am taken to a screen where I can drill down to truly find the error.
Many times, you will end up in the eG Layers screen, shown in Figure 7.
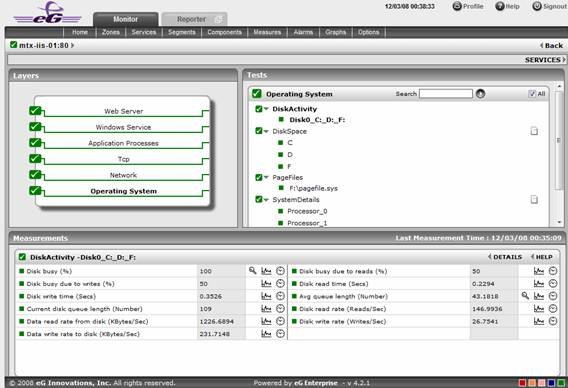
Figure 7: Layer of the component
What I did was click on the second measurement’s alarm, where an IIS server had 100% disk utilization. This brought me to the eG standard layered model of that IIS server. You can see very quickly that the Operating System layer is bold and on the right I see that disk activity from Disk C, D, or F is at 100%. Both the tests and the measurements show this. The same layered model, based on the familiar ISO stack, is used to represent the components of all 85+ applications eG Enterprise supports out of the box. This presents a consistent interface to IT admins and greatly simplifies the task of identifying root cause.
The amazing thing about eG’s solution is that it understands the components that make up that IIS Server – the web services, the windows services, application processes, TCP, Network, and down to operating system.
If I were to click on a VMware ESX host, eG VM Monitor would understand the ESX host and guests that are loaded on top of it. For example, it knows the VM guests, host, VM processes, TCP, network, and operating system (shown in Figure 8). eG has a patent pending on this technology, which it calls In-N-Out Monitoring.
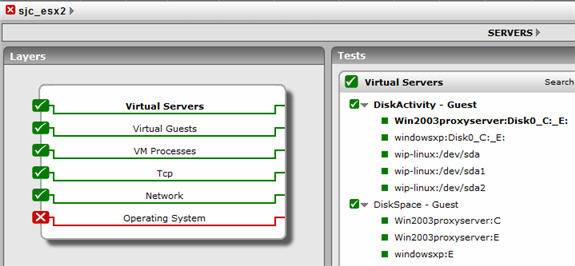
Figure 8: VMware ESX host monitored by eG VM Monitor
What are the special considerations for monitoring ESX hosts?
Just a few things you should know about monitoring VMware ESX systems:
-
If you are going to use the agent, you need to install it in the service console.
-
If you are running ESXi and cannot use an agent, you need to create a remote monitor on the eG VM Monitor host.
-
Either way, the firewall ports on the ESX host need to be opened up to allow for monitoring. To do this, you would use commands like this:
esxcfg-firewall –o 7077,tcp,out,eG
Here is what they look like once they are opened:

Figure 9: Ports opened on a VMware ESX host
-
There is no downtime to install an eG VM Monitor agent
What makes eG VM Monitor unique?
The eG VM Monitor did not win the “Best of VMworld 2008” in the Application and Infrastructure Management category without good reason. Let me spell out some of these reasons:
-
Enterprise grade – supports monitoring of thousands of servers and security roles.
-
Supports about 100 different types of devices – including APC UPS, Blackberry Server, Cisco router, Citrix, Microsoft enterprise apps, MySQL, Oracle, and VMware.
-
Agentless or agent-oriented installation, where agentless still provides the same statistics.
-
A single agent for all devices, applications, operating systems and CPU configurations.
-
Understanding of internal and external performance – not only a server’s perf stats but what is going on across the network that may be affecting that server (eG’s In-N-Out Monitoring technology).
-
Again thanks to In-N-Out Monitoring, eG VM Monitor can, with a single agent, monitor performance of the ESX host and all guests running inside that host. Also, eG VMotion monitoring and VDI monitoring are major features of eG VM Monitor.
-
In addition to VMware ESX and ESXi servers, eG VM Monitor supports CitrixXen Server, Solaris Containers and Sun LDoms. This is an important point because data centers are increasingly deploying multiple virtualization platforms, and they can use eG VM Monitor with all of them.
How doe eG VM Monitor rank?
I was highly impressed with what the eG VM Monitor has to offer. Every product has good and not-so-good features.
The Good
The best thing about eG VM Monitor is that it offers the most complete picture of the infrastructure – both virtual and physical — of the VMware ESX Infrastructure that I have seen available (multi-tiered). This article, prior to this point, has already done a good job of laying out what eG VM Monitor has to offer.
The Not-so Good
Every product has good and not-so-good (or bad) features (or just a lack of features). This would not be an unbiased review unless I included both sides noted in testing the eG VM Monitor. It is a complex product, but installation does not have to be complex. In my experience, the installation was more difficult that it has to be. I wish that eG VM Monitor could find a way to get the software installed more easily. I had to download Java Developers kit, then SQL Express, and call support to get some help tweaking SQL before it would install.
However, on the good side, this gave me a chance to try out eG’s support. I can tell you that the technician who helped me was professional and extremely helpful. He answered the phone on the second ring. He used remote control to fix everything and ensured that eG VM Monitor was working and monitoring a single ESX host before he got off the phone. I can highly recommend eG’s support!
Conclusion
Overall, I give the eG VM Monitor a rating of 4.8 out of 5 because they have a unique offering that performs “as advertised.” Normally I would not give such a high score but, like the judges at VMworld, I believe that what eG VM Monitor offers is very different from the other vendors that just offer network monitoring tools that happen to monitor ESX or ESX monitoring tools that only monitor ESX statistics. I do recommend that all VMware ESX admins try out eG VM Monitor for themselves!!
VirtualizationAdmin.com Rating 4.8/5

For more information about the eG VM Monitor, Click here