How often do you find that you have an Exchange server that is running, but nothing is actually responding? Or how often do you have email queues or slowness that somebody eventually reports, only to find you have a server that is not properly running? How about if a server reboots but not all the services start up? Or you have a disk that is not mounted and so the transport service (for example) won’t start? Another common issue is when in spite of having monitoring tools like System Center Operations Manager (SCOM) or SolarWinds — or any other monitoring tool that gets a ping response back from the server — the tool reports online and fine.
Wouldn’t you rather have a report that can run on a schedule and give you an overall view of what your Exchange servers are doing? Then read on:
An MVP developed a report a few years ago that gives you an overall health status of your Exchange server, Database Availability Group (DAG), and mail queues. It also reports on services, up-time, and mail flow tests as some of the highlights of this report.
I have implemented this report in my own lab work environment and suggested it to other colleagues and friends that manage Exchange. This report works with Exchange 2010, Exchange 2013, Exchange 2016, and Exchange 2019. It run quickly even in the largest of organizations that have a few hundred servers. Here is a glimpse of what the report looks like (with some information removed):
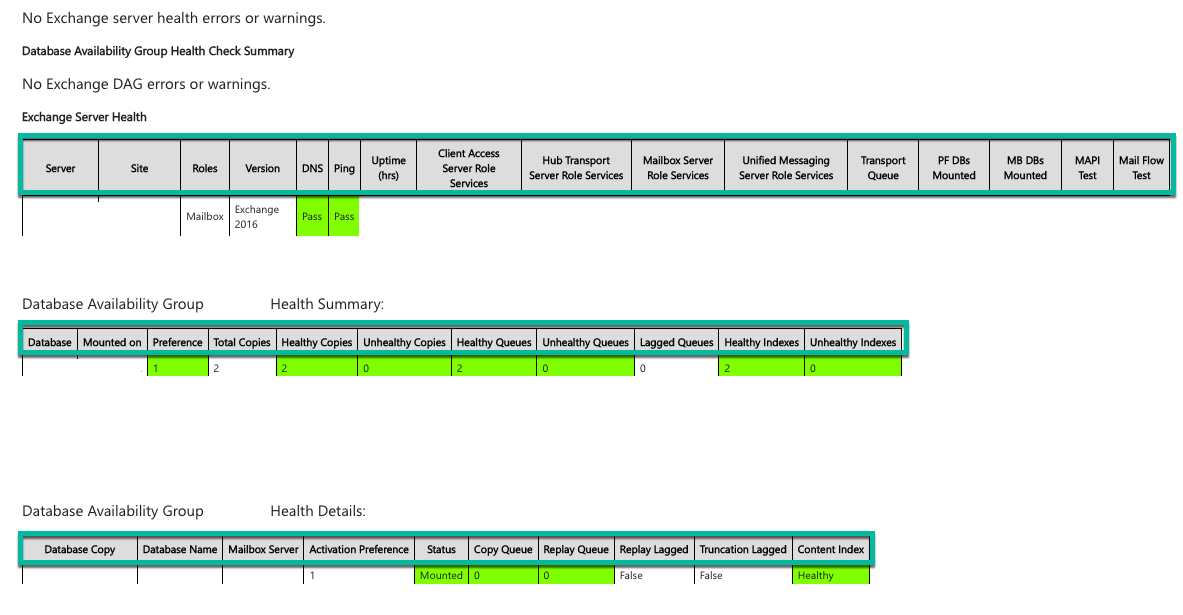
As you can see, the report is neat and provides a lot of information. Let me take you through the report.
On the top, you will notice it says “No Exchange server health errors or warnings.” If you have nothing wrong in the environment, no information will display — which is a good sign. If you do reboot a server, it will show up under that section — but it is nothing to be concerned about, as the message will go away once 24 hours has passed. Other errors that you may see reported in this section are:
- high email queues for a server
- services not running on a server
- failure to perform a Mail Flow Test
- server offline
The nice thing about this report is that if you look at the code, you can create a file to exclude servers and they won’t report.
In the next section is the “Database Availability Group Health Check Summary.” It will list if a mailbox database copy is on the wrong preference or if there is a problem with a database availability group copy. Note that if you are performing mailbox moves that builds up a replay queue, it will report a problem with that copy. Though it is not a problem with the server per se, you should check why the logs are not flushing.
In the rest of the report, you get more information about the database availability group (DAG) and the cluster status. Seeing “Pass” in the report, along with a green block or green line, means that Exchange is humming. Numerous times this report has provided me with valuable information that prevented a disaster.
Your hub queues will show here as well and you can fine tune the report if the settings do not fit your organization. For example, if you have 20 – 3o mails in your shadow queue and the report keeps giving errors on it, try increasing the number to something like 50 after you have made sure you do not have an issue. You will see the color change to yellow for one threshold and to red for another threshold.
In the report, you can specify a server to send the report out — either to an individual or to the team that manages Exchange. Schedule this report using Task Scheduler. Ensure that the account provided has permission to run the report and to read the properties in Exchange. If you find that the report is providing the wrong version of the servers in your environment, you can edit it and add in the cumulative update (CU) information.
Finally, one thing I have noticed is that if you have a machine that is stuck, perhaps your hypervisor has failed over or blue screened if Hyper-V or purple screened if VMWare, the report may get stuck and not send you anything. If you launch an elevated PowerShell prompt or the Exchange Management Shell and run the report from your saved location manually, you will get to the point where it gets stuck and you can reboot that server.
Please note, this is not my script, I only use it and recommend it others. If you head over to Practical 365, you can read all about the version changes and also contact the author if you have any questions or errors.


Hi,
I have configure health check script for exchange 2019 on prem.Its working fine and generate report
but in last column it show indexes in red and also show not applicable content index i have searched on google and i came to know its by default in exchange 2019.Tell me that how can i remove these columns from script so it will not show in report.
Thank You