We covered several features of Network Watcher in a previous post here at TechGenix. However, today we will use the Connection Monitor feature to monitor connectivity to partners, external sites, or internal sources.
When deploying a product/service in Azure that requires connectivity, it is key for the DevOps team to be aware when connectivity becomes an issue and start acting on the issue as soon as it arises.
The idea behind this article came from a customer of mine that requested a process to monitor connectivity between their Azure cloud solution and some partners connected either through a VPN or the Internet. The application required the integration between Azure and other partners through Azure VPN. Using Network Watcher and Connection Monitor, we can easily achieve the environment’s continuous validation and report when a connectivity issue arises.
The entire process is simple. We need to provision a VM, enable Network Watcher, and configure the Connection Monitor, and that is it! After that is just a matter of looking at the portal to be informed about any issues connected with your partners or check your email (if you enable an alert on the monitoring that we are about to create).
Creating a Linux VM
Our first step is to create a brand new VM that we will use to monitor our remote servers and sites. We will keep it simple and create a Linux VM with a modest VM size and no connection from the outside world (Internet). As a matter of fact, we are not even planning to connect to that server’s console.
Logged on the Azure Portal, click on Create a Resource, select Ubuntu Server from the list. In the new Basics tab, select and define the basic settings for this new server, including subscription, VM name, size, authentication, etc. When done, click Next.

We don’t need any special configuration on the Disks, Management, and Tags. The only area that we should pay extra attention to is the Network tab. Ensure that we place the server in the virtual network that we want to test the future connections that we will be monitoring using Network Watcher.
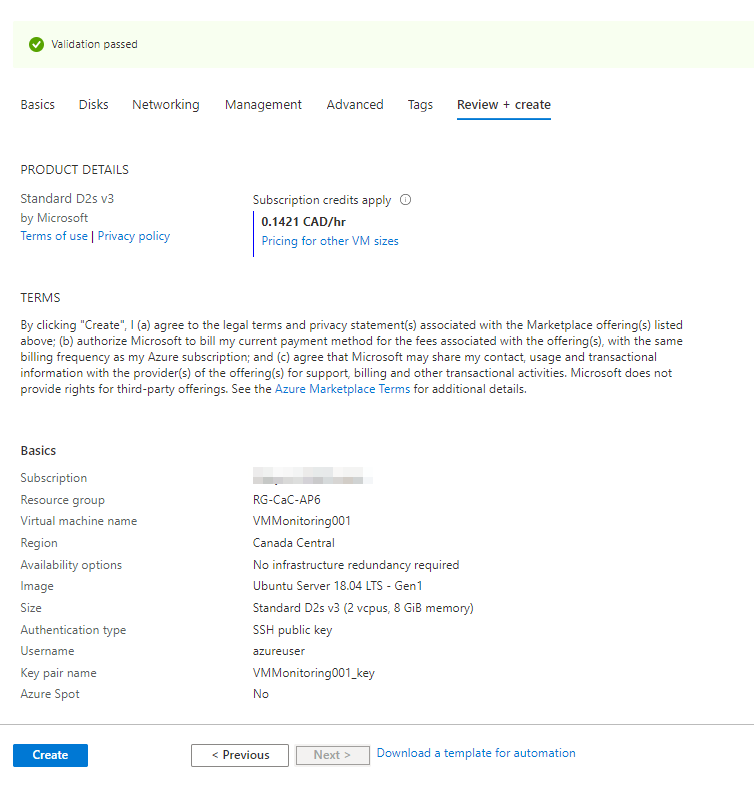
The final page will be a summary of the entire options defined so far. Click on Create.
Enabling Network Watcher
We have the virtual machine created, and our next logical step is to enable the Network Watcher. Logged on to the Azure Portal, search Network Watcher, and click on it from the list.
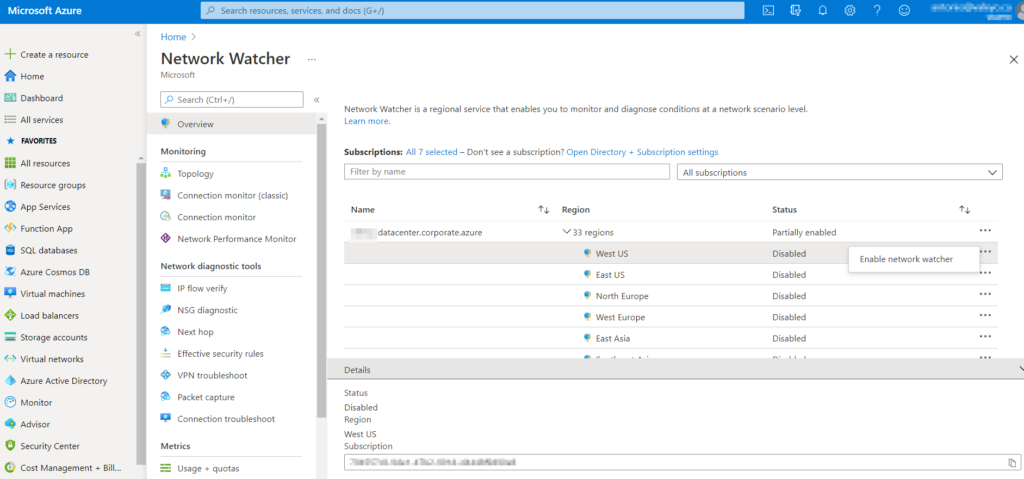
In the Network Watcher blade, expand the desired subscription and click on the region where your application/solution will be provisioned. Click on … and then click on Enable Network Watcher, as depicted in the image below.
Configuring network monitor
We have a VM ready to be used and Network Watcher enabled on the regions that we defined in the previous step. We can start configuring the connectivity with our partners and solutions.
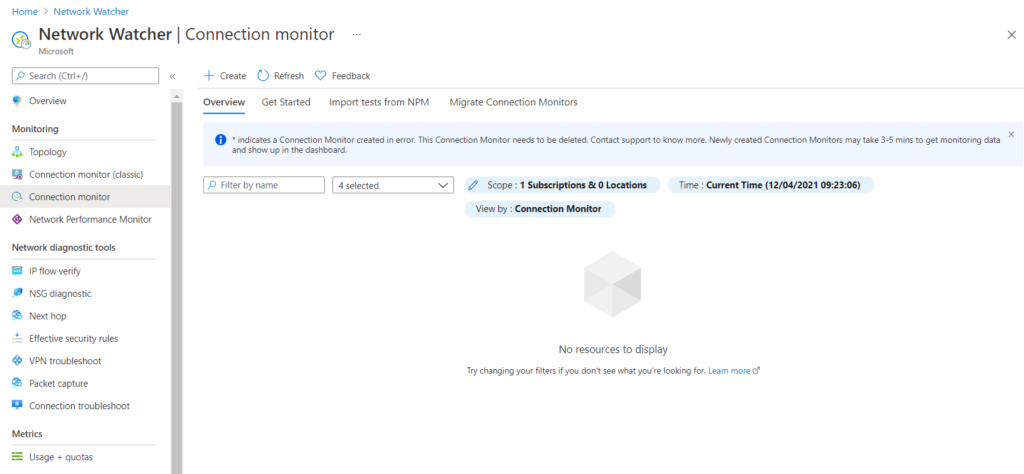
In the Network Watcher blade, click on Connection Monitor. Click on + Create
In the Create Connection Monitor wizard. In the Basics tab, we need to define a name for this first monitor, select subscription and region. We need to define Log Analytics as well. We can use a Log Analytics created by the Connection Monitor or a specific one, and we will be using our Log Analytics in this article.

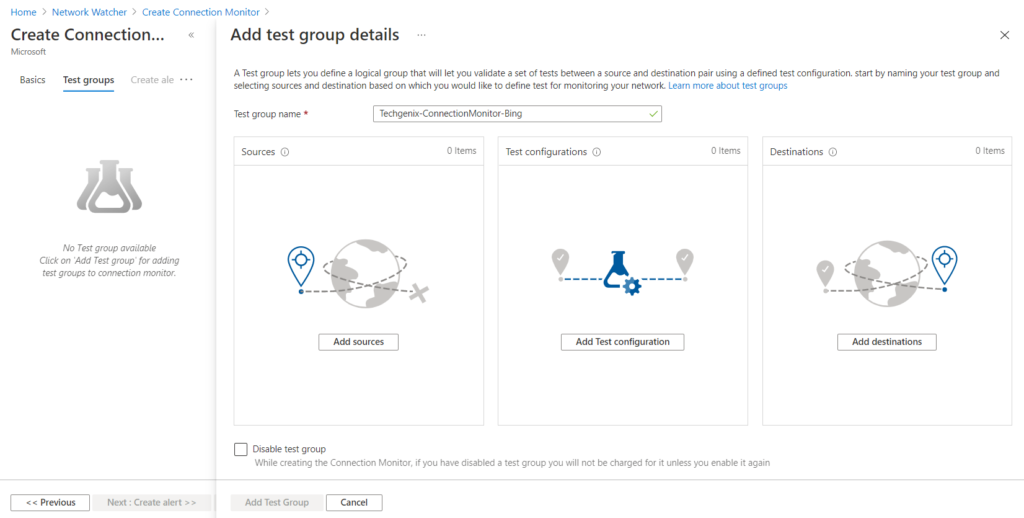
In the Test Groups tab — here is where the magic happens. We will define a source (VM), test configuration (how we are going to monitor), and destination (the partner/application). Make sure to create the Test Group name before hitting the Add sources button.
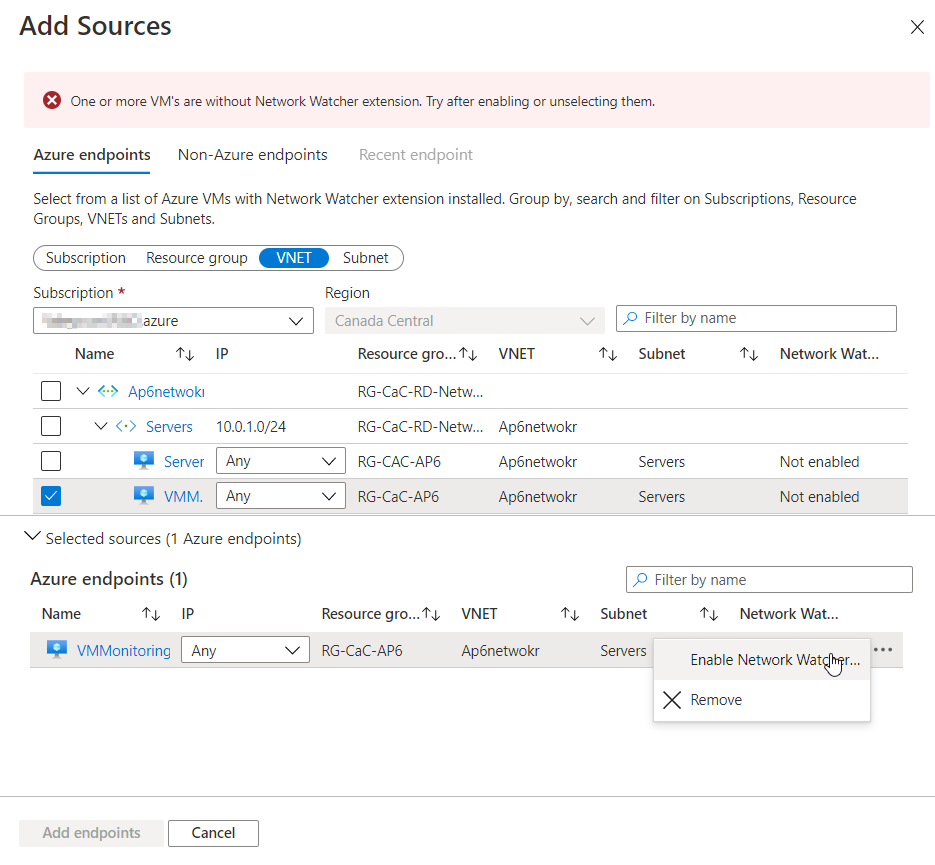
When adding a new source, select the VM from the list (we can narrow it down by subscription, resource group, VNet, or subnet). After selecting the VM, click on the Select Sources area at the bottom of this same page.
If the VM does not have the Network Watcher extension, click on … and then Enable Network Watcher. This task will install the agent on the VM. After completing the extension installation process, click on Add endpoints button.
Back to the main page, time to configure how we will validate by clicking on Add Test Configuration.
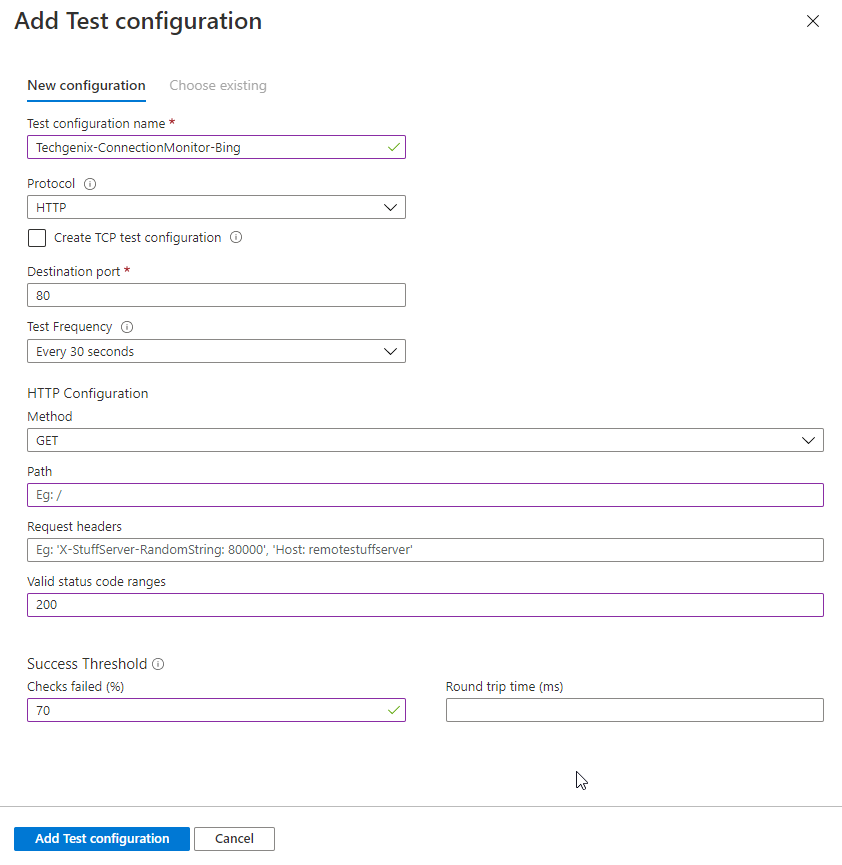
On the new page, define a name, protocol, port, test frequency, and additional details to validate the application/service that we are monitoring. In our scenario, we are checking the 80 port and looking for the 200 status code, as depicted in the image below. We can define the threshold for the checks failed and also latency.
The final section is the destinations. We can customize by adding a new endpoint (also known as target) or use one of the existing ones. Click on External Addresses, click on Add Endpoint button, and enter the required information (we added www.bing.com for testing purposes). Click on Save.

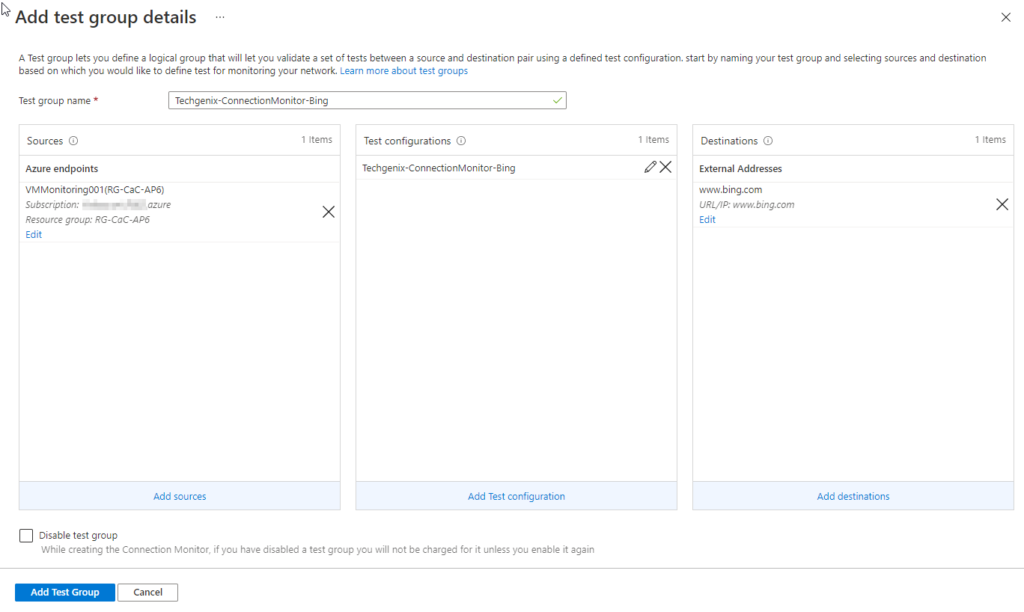
We completed the three areas of our new Test Group, and we can see all the settings defined so far in a single view. Keep in mind that we can add more items to every single area. When complete, click on Add Test Group.
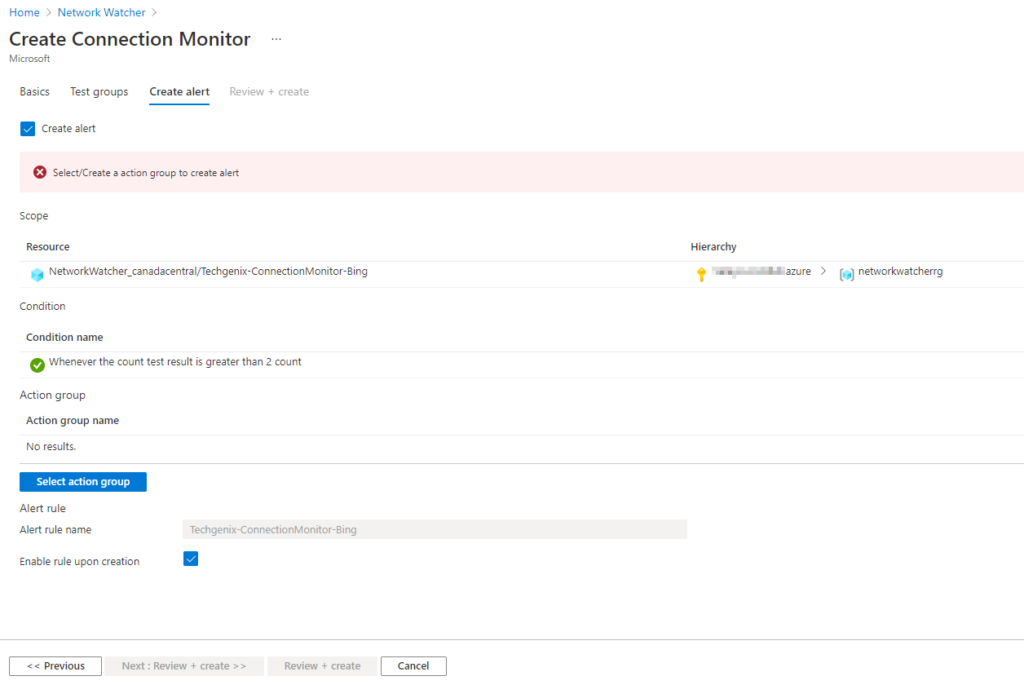
The next page of the wizard is the ability to define an alert. If you miss this tab or not ready yet, don’t worry, we can always create the alert later on.
If you want to create the alert instead, you need to define the Action Group (the email address of the person or group that will receive the notification) and the Alert Rule name. Complete the wizard by clicking on Review and Create, and after the validation is complete, confirm the operation by hitting Create button.
Using Network Watcher
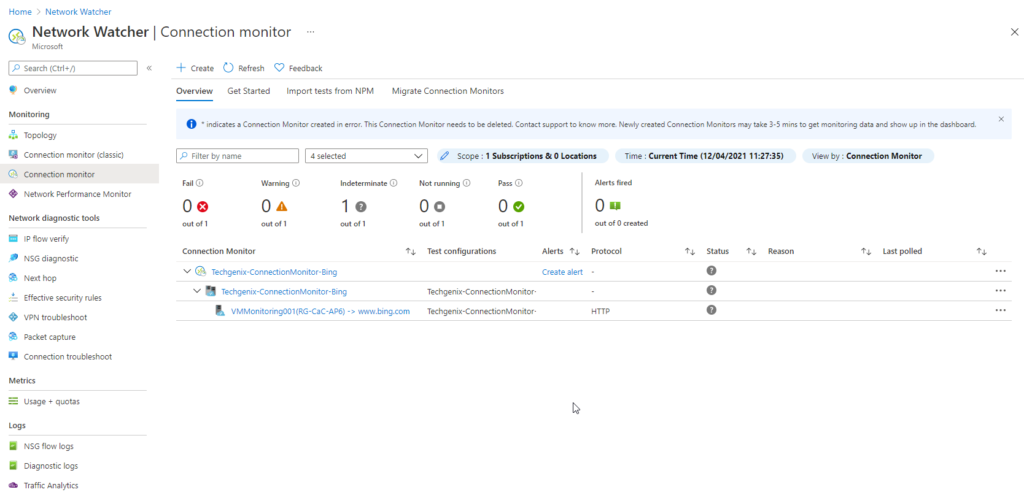
We build the infrastructure to support the entire process to create a Connection Monitor. The result of all our hard work in this article is a nice single pane of glass panel that summarizes all Connection Monitors that we have configured on the environment.
We have several options to understand the metrics and numbers available as part of this Connection Monitor. You can start by clicking on the Connection Monitor items, specific VM, etc.
When looking at a specific component like the VM itself, we can see a graphical representation of the source and target. We can filter by hops, download topology, and check logs and performance charts. The performance area is being displayed on the right side, and it helps the cloud administrator see the round-trip performance for the connection.

This article covered all steps to configure a simple VM, enable Network Watcher, and start monitoring partners and applications using the Connection Manager feature.
Featured image: Pixabay