If you would like to read the other parts in this article series please go to:
- SMTP Routing in Exchange 2010 (Part 1)
- SMTP Routing in Exchange 2010 (Part 2)
- SMTP Routing in Exchange 2010 (Part 3)
Queue Viewer
As explained in SMTP Routing in Exchange 2010 part 1 that all messages are always stored in Queues. Using the Queue Viewer’s tool it is possible to view the queues and the properties of these queues. Please, note that you can also check the properties of the messages but you CANNOT view the actual messages.
To open the Queue Viewer, open the Exchange Management Console and navigate to the Tools section. There you’ll find the Queue Viewer. When you open the Queue Viewer you can see the SMTP queues on this particular server.

Figure 1: Queue Viewer on Exchange 2007. It’s the same on Exchange 2010
You can see the status of the queue, the number of messages and the last error the SMTP Service has encountered for this queue. When the status is “ready” and the message count is “0” the message is successfully delivered and the queue will be removed shortly.
The number of messages in a particular queue can grow, but except for NDR’s as a result of spam (sent from a non-existing domain) the queue will shrink automatically within a reasonable amount of time when all is well. If messages cannot be delivered in a timely manner, the messages will be deleted from the Queue, typically within 48 hours and an NDR will be sent to the sender (in your Exchange environment that is). There can be a number of reasons why a legitimate message cannot be delivered. A DNS error, network issues on your side, network issue on the recipient side, server issue on the recipient side, just to name a few…
The queue viewer only shows the queues for one Hub Transport Server. If you want to check another Hub Transport Server you have to select “Connect to Server…” in the Actions Pane and select another Hub Transport Server.
You can also use the Exchange Management Shell to check the queues on the Hub Transport Server (my personal preference) using the Get-Queue cmdlet on the Hub Transport Server:

Figure 2: You can use the Get-Queue cmdlet to check the queues
When you combine the Get-TransportServer cmdlet with the Get-Queue cmdlet you can see all queues on all Hub Transport Servers. This will give a quick overview, and it is much faster than using the Exchange Management Console.
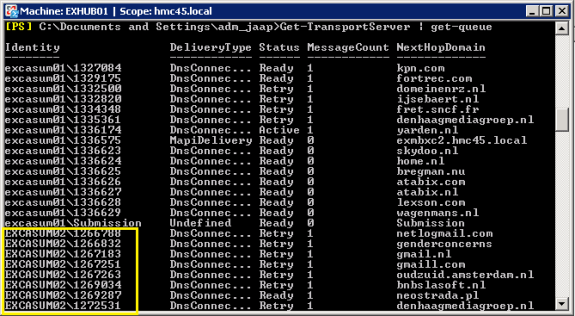
Figure 3: Check multiple Hub Transport Servers with the Get-Queue cmdlet
Normally, the SMTP queues will appear and disappear, queues will grow and shrink. If you have a particular queue that’s growing you may want to troubleshoot.
Johan Veldhuis wrote an interesting article regarding Exchange 2010 Queues and the status queues can have. You can find his article here.
The first question of course is “is this a legitimate domain and are there legitimate e-mails?” When you have 150 messages destined for a domain called “iwanttobuybigbluepills.com” or something like that you can be pretty sure there are 150 NDR’s waiting to be delivered as a result of SPAM.
The queue will be automatically cleaned up typically after 48 hours or so, but if you want to empty the queue immediately, open the Exchange Management Shell and enter the following CMDLets:
Get-Message -Queue “<<server>>\435” | Remove-Message -Confirm:$false
Assuming of course that the messages are in queue 435, but this will vary per situation. If the queue is for a valid domain check the last error of the queue. When it’s a DNS issue check the MX records using the NSLOOKUP utility. Open the NSLOOKUP utility and set the query type to MX and enter the domain name. It will show the MX records and the accompanying A records of the mail servers:

Figure 4: Use the NSLOOKUP tool to gather information regarding external mail servers.
The next step is to check if there’s network connectivity to these mail servers by using the PING command. When successful use the Telnet Client utility to open a connection on port 25. The Telnet Client utility is not installed by default (unfortunately) but use the Windows 2008 (R2) Server Administrator to install the Telnet Client utility. It can be found under the Features option.
Using the Telnet Client utility, open a connection to the recipients SMTP host on port 25:
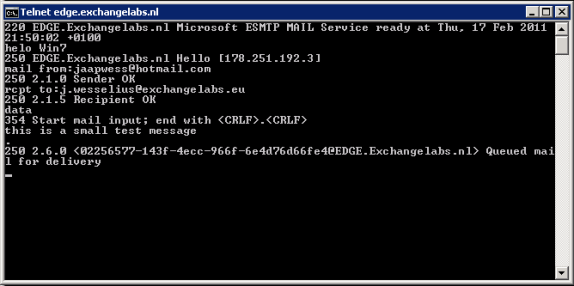
Figure 5: Use TELNET to open a connection and check if you can send a test message
When checking the mailbox we can see the message has actually arrived:
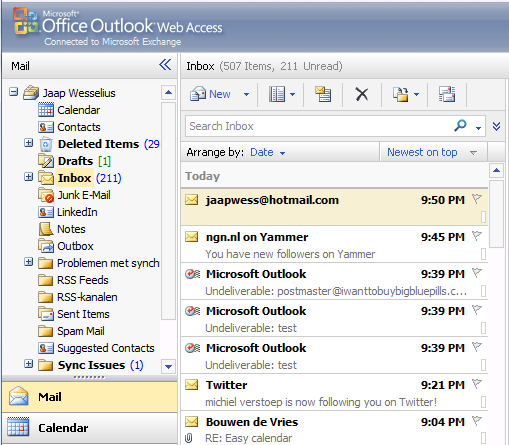
Figure 6: The test message from TELNET has arrived!
So, using the Get-Queue cmdlet combined with the NSLOOKUP, PING and TELNET client you have a very powerful set of tools for troubleshooting the message flow. If you’re not familiar with the Telnet possibilities in combination with the SMTP Service please check out the following Microsoft article here.
Transport Logging
Another way of troubleshooting the SMTP transport is by means of protocol logging. The SMTP service has the ability to log all actions it performs. Because it logs everything this functionality is disabled. Enabling it can be useful but should only be used for troubleshooting purposes. If leaving this enabled in a production environment the local disks will quickly fill-up with logging information, and a completely filled boot and system disk generally means a dismounted server.
To enable protocol logging on an SMTP connector, open its properties in the Exchange Management Console and set the “Protocol Logging Level” to verbose on the General tab:
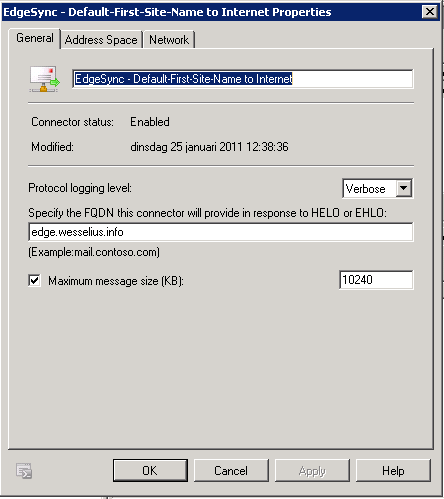
Figure 7: Enable logging on the connector
The SMTP Transport logs are now stored on the following locations:
C:\Program Files\Microsoft\Exchange Server\V14\TransportRoles\Logs\ProtocolLog\SmtpSend or C:\Program Files\Microsoft\Exchange Server\V14\TransportRoles\Logs\ProtocolLog\SmtpReceive
There are tons of information in these log files and they can be very useful for troubleshooting the SMTP communication between servers.
There’s one nifty issue though! Check out the following screen shot from the Exchange Management Console where an Edge Server is used in combination with a Hub Transport Server:
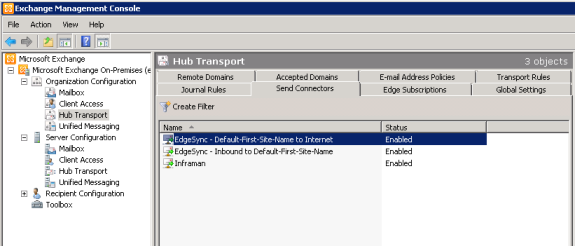
Figure 8: Only Edge related connectors are visible, not the connector between Hub and Edge Servers
If SMTP transport logging is enabled on these connectors, logging will occur on the Edge Transport Servers. There’s no way here to enable logging from the Hub Transport Server. The same is true for SMTP traffic between Hub Transport Servers in different Active Directory sites.
For these purposes a hidden connector is used, and protocol logging should be enabled on this hidden connector. This can only be performed using the Exchange Management Shell by entering the following cmdlet:
Set-TransportServer EXCH01 –IntraOrgConnectorProtocolLoggingLevel Verbose
Now logging will be enabled on connectors between the Hub Transport Server and the Edge Transport Server and between Hub Transport Servers in different Active Directory sites.
Routing Table Viewer
In my previous article regarding SMTP Routing I talked about the Routing Table on a Hub Transport and Edge Transport Server. This Routing Table is an in-memory table containing the Exchange organization’s routing infrastructure. This Routing Table is automatically calculated based on information found in Active Directory or sent from the Hub Server to the Edge Server in case of an Edge Transport Server.
The SMTP Service takes a snapshot of the Routing Table periodically and saves it to disk. This snapshot is taken:
- After a fixed amount of time;
- When the Transport services is (re)started;
- When the routing configuration changes.
To view these snapshots, open the Exchange Management Console, navigate to the Tools section and open the “Routing Log Viewer”. There’s information regarding the Active Directory Sites, Routing Groups, Exchange servers, Send Connectors and Address spaces.
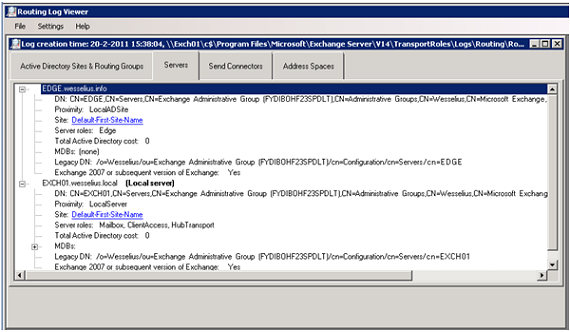
Figure 9: A snapshot of the Routing Table on a Hub Transport Server
Tracking Log Explorer
All messages that are sent or received by an Exchange organization are logged in so called “Message Tracking” log files. These log files are large text files (stored in C:\Program Files\Microsoft\Exchange Server\V14\TransportRoles\Logs\MessageTracking) and can be searched by a tool called “Message Tracking Explorer” which can be found in the Tools section of the Exchange Management Console.
Note:
There’s also a tool called “message tracking” under the Tools section, but this one will redirect to the Exchange Control Panel. This part is about the Tracking Log Explorer, a separate entry under the Tools section in the Exchange Management Console.
The Message Tracking Explorer can search on Sender, Recipient, Subject, Message ID etc. And EventID can be selected, like Send, Received, Submitted, etc.
The Message Tracking Explorer can be used for troubleshooting when users complain about messages that are not received or got lost or something. Of course these messages can only be searched within the Exchange organization. When messages are sent outside the Exchange organization they’re ‘out of sight’ and further message tracking is no longer possible.
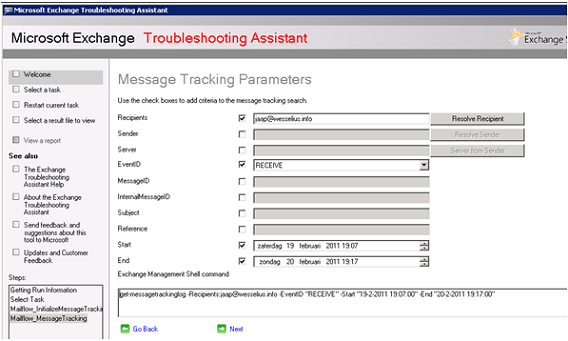
Figure 10: Message Tracking in Exchange 2010. Note the corresponding Powershell command.
One side step regarding the message tracking log files. From a compliancy perspective it can be necessary to back up the message tracking log files in your (daily) backup cycle. This way the message tracking log files don’t get lost in case of a server failure. As mentioned earlier, the message tracking logs can be found in the directory C:\Program Files\Microsoft\Exchange Server\V14\TransportRoles\Logs\MessageTracking. Be aware that these log files can grow significantly!
Conclusion
In a series of articles I explained the functionality of the SMTP Transport Service in Exchange Server 2007 and Exchange Server 2010, also sometimes referred to as the Transport Pipeline. We’ve seen internal routing, external routing, send and receive connectors and in this final article I explained a bit more regarding troubleshooting and logging on the transport service. By default most functionality is enabled, but for troubleshooting purposes it is needed to tweak a bit more.
If you would like to read the other parts in this article series please go to: