If you would like to read the next parts in this article series please go to:
- Scripted Network Defense (Part 1) – Programmatic Defense of Windows Hosts Against Network Attacks
- Scripted Network Defense (Part 3) – Advanced Techniques
Introduction
In the first part of this series we discussed the idea of defense-in-depth and how, using a bit of scripting, PCs can assume some of the burden of defending themselves against network attacks. We took on one of the classic attacks in the Ethernet world, ARP poisoning, and showed how one might try to defeat it programmatically. In that example, the script ran a single time, at boot-up, and set a static ARP table entry for the Windows default gateway.
Networks, however, are highly dynamic and monitoring may need to be conducted on a continuous basis. A script that runs just once at boot-up and then exits isn’t going to fit the bill. This article introduces the use of the Windows Performance Monitor (Perfmon) -generated events and task triggers. These tools will enable you to conduct ad hoc scripted host-level monitoring and defense of the network stack based on any metric in Perfmon.
The Flood
For our next example, consider the classic network Denial-of-Service (DoS) attack based on flooding a victim with bogus TCP SYN packets. This is an old attack, yet the Windows OS still doesn’t come installed with built-in protection (you can see some registry values, as outlined in the article below, but they’re not set out-of-the-box). If you’re not up-to-speed on this attack, a couple of good sources are:
- The original CERT advisory
- Microsoft TCP stack hardening recommendations
You can also find discussions of this attack in the forums on our very own WindowsNetwork.com site. It should be noted that network firewalls and routers can be configured to mitigate this kind of attack, but the focus of this present article, once again, is host-level security.
What I want to look at here is how one can detect an attack in real-time and automatically capture valuable forensic evidence. To do so, we’ll use Perfmon to devise a data collector set that can trigger a script of our choosing when certain parameters it’s watching exceed a threshold. That sounds like a mouthful but it’s not hard — let’s walk through the process.
To generate the attack condition in my lab I utilized the free network security / hacking tool Ettercap to produce the DoS attack (I won’t cover its use here, but if you are truly interested there are many free video tutorials on the internet). One of its numerous attack plug-ins is, conveniently, labeled DoS Attack. Don’t feel any trepidation about playing with this kind of tool (but do it in a lab, not a production LAN!). It’s not just the bad guys who use these tools – security pros learn how to defend against an attack by running it themselves live in their lab.
Attack Signature
Half the battle when trying to counter a potential attack is figuring out how to detect it. Or, in spy jargon, what constitutes an attack “signature”? Personally, I like to use Perform, add a lot of counters to its watch list, launch an attack, and see what sticks out as a variance from normalcy, i.e. I try to let the system teach me. This procedure is as much art as science and narrowing down what you think is worth monitoring gets easier and faster with experience.
In the case of the TCP SYN flood attack, the simplest possible attack signature is pretty obvious: a large number of TCP connections. You should run Perfmon to get a sense of what normal traffic looks like in your environment but common sense suggests that except on the busiest servers, anything over a couple of thousand connections would be unusual.
Fire up Perfmon, click the big “+” button, look for TCPv4 and add the desired counter:

Figure 1: Perfmon counter for detecting a possible SYN flood attack
I’ve found that a typical SYN flood attack in my lab caused a rapid rise to over 30,000 established connections:

Figure 2: Possible signature of a SYN flood attack
Continuous Monitoring
Now that we know what an attack looks like, we can take advantage of a feature of Perfmon known as a User Defined Data Collector Set (UDDCS) that allows us to periodically monitor any system counter and generate an alert or run a script based on conditions of our choosing. To create our UDDCS, expand Data Collector Sets in the Perfmon window, right-click User Defined and create a new set:

Figure 3: Creating a User Defined Data Collector Set
In this case we’ll use the manual (advanced) method so that we can choose our own counters. Click Next and choose Performance Counter Alert:
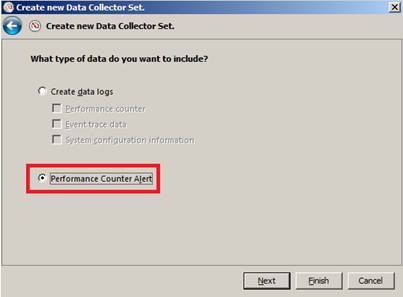
Figure 4: We want our Data Collector Set to generate an alert
Click Next, then select the desired counter and a threshold:

Figure 5: Value and threshold to monitor
Click Next and choose to modify this UDDCS’s properties:

Figure 6
Click Finish and set a Schedule. Basically we want this monitoring task to run in the background on a continuous basis. We’ll simply start it but not set any stop condition (below, we set the actual sampling interval). Alternatively you can configure a Data Collector Set to only run certain times of the day – fine for many purposes but not for ongoing monitoring.

Figure 7: Pick any time — we just want to assure that the task begins
Click OK. When you’re brought back to the main Perfmon window right-click on DataCollector01:

Figure 8
The next thing we’ll configure is the sampling interval. For our purposes once-per-minute is probably fine:

Figure 9: Picking a sampling interval
Next click on Alert Action and configure this alert to make an entry in the event log:

Figure 10: Configure alert to write to the event log
Now start the task (Perfmon > Data Collector Sets > User Defined > SYN Flood Attack Detector > right-click > Start). At this point you can try to trigger an alert, e.g. by running the attack you’re trying to defend against. Check performance logs and alerts in Event Viewer > Applications and Services Log > Microsoft > Windows > Diagnosis-PLA and look for event ID 2031:

Figure 11: Alerts for user-defined conditions are stored under Diagnosis-PLA
Event ID 2031 is a generic alert that could apply to any admin-defined condition, but for the sake of simplicity we’ll assume it’s the only alert we’ve decided to define (if the need arises for you to distinguish different kinds of events, additional scripting will do the trick).
Task Magic
Now comes the magic – we’ll attach a task to the alert. Whenever the alert is written to the Windows Event Log, it will also trigger a task, e.g. a script whose actions are limited only by your imagination. For example:
- Right-click the event ID 2031 and choose Attach Task to This Event
- At “Create a Basic Task”, click Next
- Click Next again
- Once in the Action pane, click Start a Program, then Next
- The program I’m going to run is c:\admin\scripts\synflood-forensics.bat

Figure 12: Script to run when Event ID 2031 is logged
In this case we’re going to take a forensic snapshot of key network data at the instant of the attack:
C:\admin\scripts>type synflood-forensics.bat
arp -a >> c:\admin\logs\attack.txt
netstat -an >> c:\admin\logs\attack.txt
“C:\Program Files\Wireshark\dumpcap.exe” -i 1 -a duration:10 -w c:\admin\logs\out.pcap
Wireshark, the free network scanner, has a command line version that I’m telling to run off the first network adapter interface, run for 10 seconds, and write the results to a PCAP file. (SYN floods typically use a phony IP address but they don’t always hide their MAC address, which might be useful in an investigation).
Finish up and the new task is written out to C:\Windows\System32\Tasks\Event Viewer Tasks. You’ve now got a fully-functional TCP SYN flood monitor that automatically captures attack data as soon as the condition (25,000+ TCP sessions) triggers event ID 2031.
Obviously you don’t want to do these steps manually on every PC you want to protect. While we don’t have the space to cover it here, there are various ways to script this entire process for deployment via your standard package mechanism, AD Group Policies, etc. You might also want to clean the script up so it doesn’t overwrite older forensic data or, perhaps, takes some other action(s).
In this series we first covered the basic ideas of scripted network defense, starting with the example of setting a static default gateway upon boot-up (Part One). In this present article we’ve discussed how to use Performance Monitor to watch for certain conditions and set up a triggering mechanism for responding to them. In the final installment of this series, coming up next, we’ll dive into Windows Management Instrumentation, the deepest level of monitoring you can go in Windows without entering the kernel.
If you would like to read the next parts in this article series please go to:


Love all these helpful instructions on how to monitor Windows performance. I just want to check on one thing with step 10 ( Configure alert to write to the event log). Should you also select the data collector set you created in previous steps from that drop down? Right after that, you say to start the task, which may be what that drop down was meant for as well. I just wanted to make sure I should or should not select the data set from that drop down. Thanks!